



11 hours ago
CyberPanel server slow or overloaded? How to find the cause
Your sites suddenly load slowly, the panel takes ages to open, or your VPS provider emails you about high CPU. Before you buy a bigger server, find out what is actually using it. CyberPanel 3 has two status pages that help, and a few SSH commands fill the gaps. We went through all of them on a CyberPanel 3.0.8 server (OpenLiteSpeed, Ubuntu 24.04) and found that one of the pages doesn't show what most people expect.
Step 1: Read the numbers on Top Processes
Go to Server > Top Processes. The page refreshes every 3 seconds.
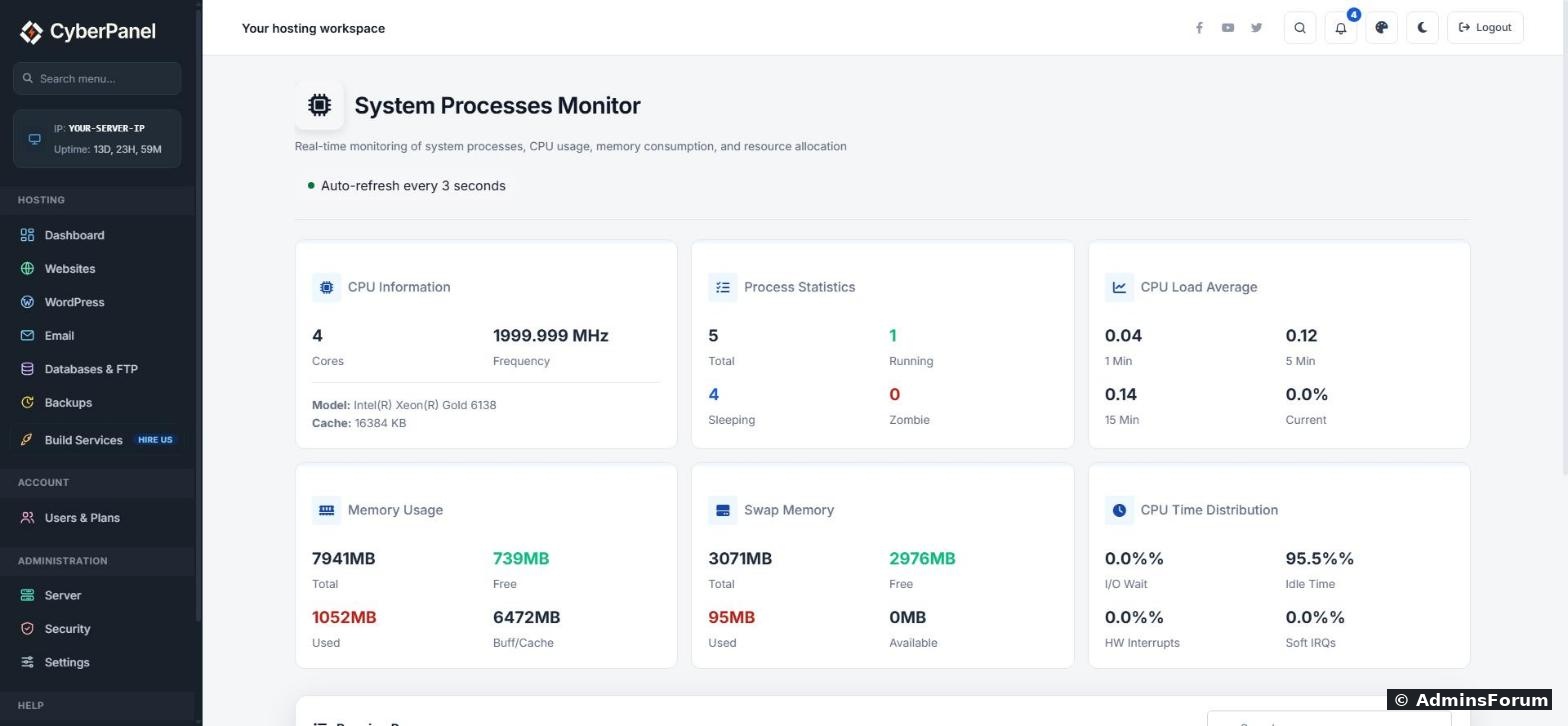
What to look at:
Step 2: Don't trust the process list on that page
Below the cards is Running Processes, with a Kill button on each line. On our server it showed only five processes, all owned by the CyberPanel user: the panel itself (lswsgi), a shell and the top command it runs. MariaDB, OpenLiteSpeed, the PHP processes of your websites and the mail services were not in the list at all. So when a WordPress site or a database is eating the CPU, this list will not show it.
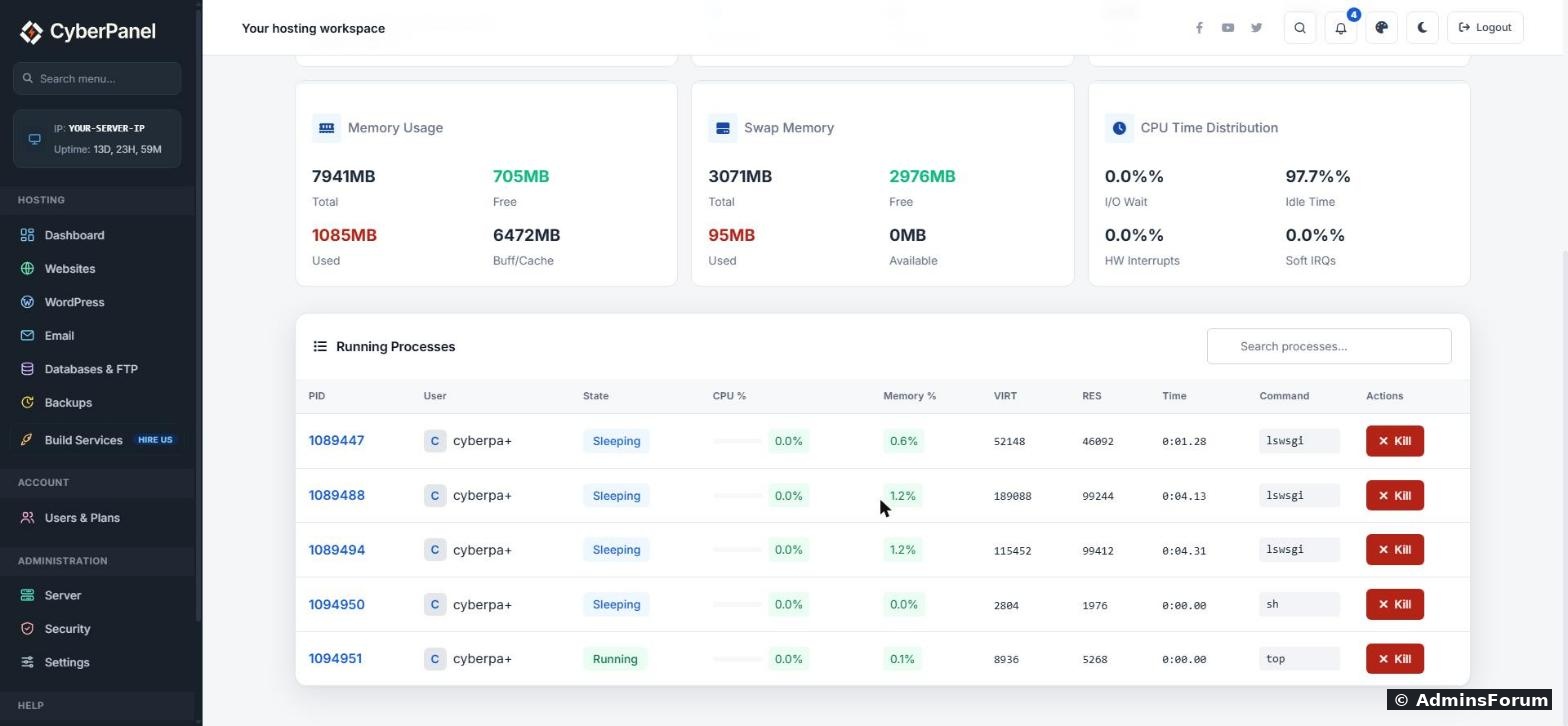
Careful with Kill here: the lswsgi lines are CyberPanel itself. Killing them can log you out or stop the panel until it restarts.
To see every process on the server, use SSH:
Press M to sort by memory instead, and q to quit. If you want a friendlier view with colours:
Step 3: Find out which website is busy
In top or htop, the USER column tells you a lot on CyberPanel, because every website runs its PHP as its own Linux user:
To see which sites are getting the most requests right now (OpenLiteSpeed keeps one log per site):
And the busiest IP addresses for one site:
Replace example.com with your domain. One IP with thousands of requests is usually a bad bot you can block in Security > Firewall or in Cloudflare.
Step 4: Check the web server version on LiteSpeed Status
Server > LiteSpeed Status shows which OpenLiteSpeed version you run and the modules loaded (cache, gzip, mod_security and so on). It's a quick way to check that LSCache is loaded and that you aren't on an old build.
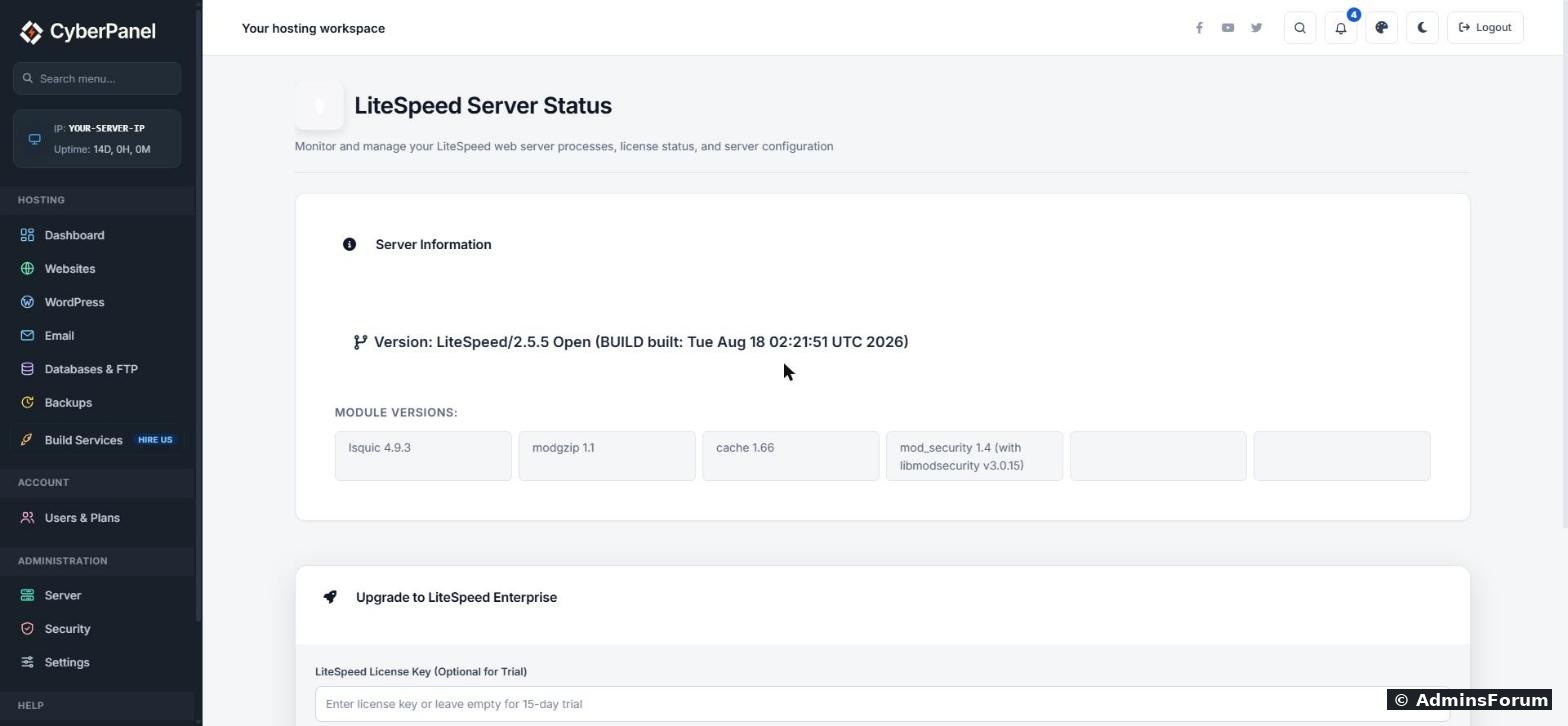
Read this before you click anything lower on that page. Below the version box is an Upgrade to LiteSpeed Enterprise section with a "Get 15 Days Trial" option. CyberPanel's own warning says you cannot switch back to OpenLiteSpeed if you don't buy a licence after the trial. Don't click it on a live server to "see if it is faster". Test Enterprise on a spare server instead.
Common causes we see, and the fix
Tested on CyberPanel 3.0.8 with OpenLiteSpeed on Ubuntu 24.04. If you are stuck, post a screenshot of top (sorted by CPU) in the Support section and we'll help you read it.
More CyberPanel guides
Your sites suddenly load slowly, the panel takes ages to open, or your VPS provider emails you about high CPU. Before you buy a bigger server, find out what is actually using it. CyberPanel 3 has two status pages that help, and a few SSH commands fill the gaps. We went through all of them on a CyberPanel 3.0.8 server (OpenLiteSpeed, Ubuntu 24.04) and found that one of the pages doesn't show what most people expect.
Step 1: Read the numbers on Top Processes
Go to Server > Top Processes. The page refreshes every 3 seconds.
What to look at:
- CPU Load Average: the three numbers are the average over 1, 5 and 15 minutes. Compare them with your number of Cores in the CPU Information box. On a 4-core server, a load under 4 is fine. A load of 8 means work is waiting in a queue.
- Memory Usage: don't panic about a low "Free" number. Linux uses spare memory as cache ("Buff/Cache") and gives it back when programs need it. Our test server showed only 705 MB free out of 8 GB, but 6.4 GB of that was cache, so it was nowhere near full.
- Swap Memory: this is the one to watch. A few MB used is normal. If "Used" keeps growing to hundreds of MB or more, the server is short of real memory and everything gets slow.
- I/O Wait: the share of time the CPU waits for the disk. Above 10 to 20 percent for a long time means the disk is the bottleneck (often backups, a big database or a slow VPS disk).
Step 2: Don't trust the process list on that page
Below the cards is Running Processes, with a Kill button on each line. On our server it showed only five processes, all owned by the CyberPanel user: the panel itself (lswsgi), a shell and the top command it runs. MariaDB, OpenLiteSpeed, the PHP processes of your websites and the mail services were not in the list at all. So when a WordPress site or a database is eating the CPU, this list will not show it.
Careful with Kill here: the lswsgi lines are CyberPanel itself. Killing them can log you out or stop the panel until it restarts.
To see every process on the server, use SSH:
Code:
top -o %CPUCode:
apt install htop -y
htop
Step 3: Find out which website is busy
In top or htop, the USER column tells you a lot on CyberPanel, because every website runs its PHP as its own Linux user:
- lsphp processes under a site user (a short name made from the domain, like cyber2602): that website's PHP is busy. Check its access log for bots or attacks.
- mysql or mariadbd high: a slow or very busy database. Often a WordPress plugin running heavy queries.
- lshttpd / openlitespeed high: a lot of traffic, sometimes an attack.
- lswsgi under cyberpanel: the panel itself, usually during a backup or upgrade.
To see which sites are getting the most requests right now (OpenLiteSpeed keeps one log per site):
Code:
for f in /home/*/logs/*.access_log; do echo "$(wc -l < "$f") $f"; done | sort -n | tailCode:
awk '{print $1}' /home/example.com/logs/example.com.access_log | sort | uniq -c | sort -n | tailStep 4: Check the web server version on LiteSpeed Status
Server > LiteSpeed Status shows which OpenLiteSpeed version you run and the modules loaded (cache, gzip, mod_security and so on). It's a quick way to check that LSCache is loaded and that you aren't on an old build.
Read this before you click anything lower on that page. Below the version box is an Upgrade to LiteSpeed Enterprise section with a "Get 15 Days Trial" option. CyberPanel's own warning says you cannot switch back to OpenLiteSpeed if you don't buy a licence after the trial. Don't click it on a live server to "see if it is faster". Test Enterprise on a spare server instead.
Common causes we see, and the fix
- One WordPress site using all the PHP: turn on LiteSpeed Cache in WordPress and check for bots in the access log. You can also limit that site's PHP Max Connections in Server > PHP Tuning so it can't starve the others.
- Swap growing all day: too many PHP processes for the RAM, or MariaDB set too big. Lower PHP Max Connections, or add RAM.
- High I/O Wait at night: backups running. Move the backup schedule or keep fewer local copies.
- Load high, nothing obvious in top: check the mail queue in the email guides below. A hacked mailbox sending spam can keep the server busy.
Tested on CyberPanel 3.0.8 with OpenLiteSpeed on Ubuntu 24.04. If you are stuck, post a screenshot of top (sorted by CPU) in the Support section and we'll help you read it.
More CyberPanel guides
- LiteSpeed and PHP tuning explained
- Update server packages from the panel
- Web Terminal is paid: free ways to get a shell
- Hostname and mail SSL (port 8090)
- Fail2ban brute-force protection
- Change PHP version per website
- Git deployment from GitHub
- SSH key login, passwords off
- Create a website
- Issue SSL and fix failed certificates
- Subdomains, addon domains and aliases
- Rewrite rules, force HTTPS, HSTS
- Install WordPress with LiteSpeed Cache
- Cron jobs and a real WP-Cron
- Redis object cache for WordPress
- Databases and phpMyAdmin
- Email, DKIM, SPF and DMARC
- Email forwarding, catch-all, plus-addressing
- Mail queue, spam senders, blacklists
- CyberPanel DNS vs Cloudflare
- Packages and website limits
- Deploy Laravel on CyberPanel
- WordPress staging (clone) fixes
- Backups: create, restore, schedule
- File Manager and FTP
- Reset the admin password from SSH
- Log files and config locations
- Check and restart services
- First steps after install
- ModSecurity + OWASP rules (fix)
- CLI cheat sheet
- Install CyberPanel on Ubuntu 24.04
- Firewall explained
- Install PHP extensions
- Change PHP settings (php.ini)
- Update CyberPanel safely
- Server Error (500) after a fresh install
- Packages, users and ACLs
- Upgrade CyberPanel safely
- Real visitor IPs behind Cloudflare
- Import a large SQL file over SSH
- Remote MySQL access for one IP
- Move WordPress to CyberPanel by hand
- Fix "Error establishing a database connection"
- Fix PHP2Shell (CVE-2026-109618/109619)
- Docker apps on your domain with SSL
- Run your own nameservers (PowerDNS)