



A controlled load test helps compare one workload at several concurrency levels. It does not prove how many visitors an entire website can support. This guide records a bounded external-client test and explains the measurements still needed for a production decision.
Environment: two-CPU shared Ubuntu VPS, aaPanel Free 8.0.7, Nginx, WordPress and PHP 8.5. The tested FPM pool had a maximum of eight children and OPcache enabled. Existing FastCGI cache rules bypassed query-string requests. The generator ran on a separate Windows machine.
1. Choose a safe target and scope
Use a lab server you control. Choose a harmless GET endpoint and a finite request count. Exclude actions that create accounts, orders, mail or database writes. Agree a maintenance window for production testing and monitor other services sharing the machine.
Our target was the WordPress homepage with a unique test query on each request. We verified the query rule returned Nginx-Cache: BYPASS before the run. This measures an uncached homepage path, not checkout, search, login or an entire browsing session.
2. Record the baseline and configuration
Write down PHP version, FPM worker limits, cache states, database version and application version/plugins. Keep those constant between phases. Record server memory, swap and CPU before testing; arrange an interval resource sampler if you need to locate saturation.
This run did not collect a simultaneous server resource trace. We therefore report response results without claiming whether PHP, CPU or SQL limited throughput.
3. Set explicit limits and stop conditions
Our client used 40 requests per phase at concurrency 2, then 4, then 8. Each curl request had a 15-second maximum time, used normal HTTPS certificate validation and performed no retries. Later phases would stop if any request failed or the sample p95 time to first byte exceeded five seconds.
A short request count bounds the total work but can miss sustained bottlenecks. Avoid unbounded loops and high concurrency simply to generate a dramatic result. Watch availability and stop manually if important services degrade.
4. Understand the client measurements
A single request example is:
This is a Windows example: NUL discards the body. Use /dev/null on Linux. Replace the hostname and make each test query unique if your verified rules use query strings to bypass caching. Do not disable certificate checks.
Time to first byte includes client-side connection and network effects as well as server waiting. Total time includes body transfer. An HTTP 200 alone does not prove the content is correct; separately inspect a sample response for application errors.
We used a bounded client worker pool to run the finite requests concurrently, waited for each phase to complete, then calculated its results. These are closed-loop tests: workers submit another request after the previous one finishes, rather than maintaining a fixed independent arrival rate.
5. Read the actual results
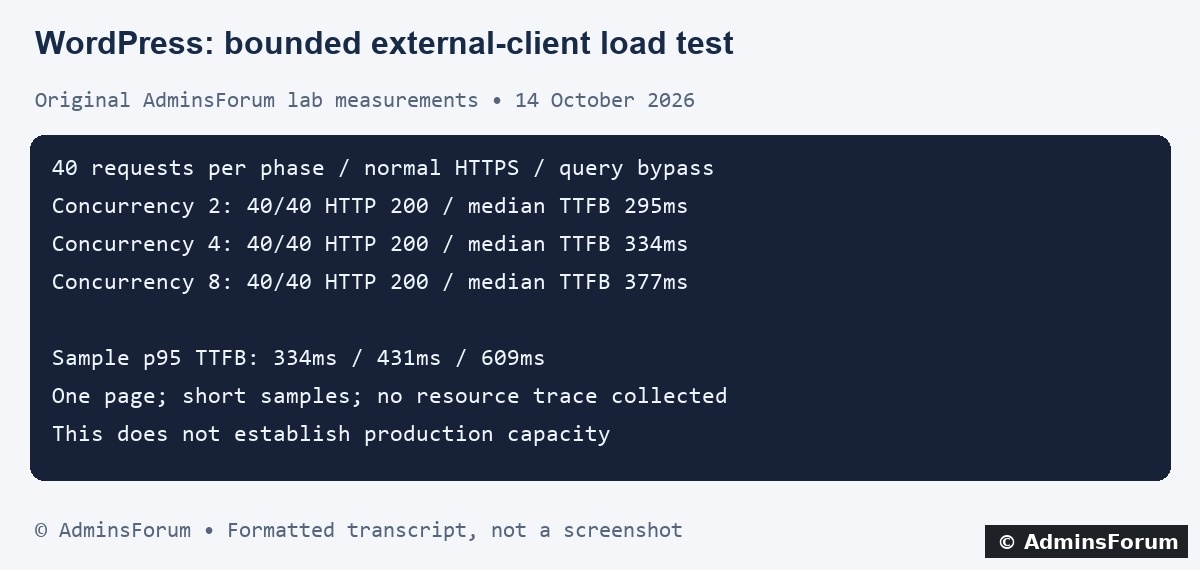
AdminsForum formatted transcript of the original client test, not a screenshot.
The sample p95 is a nearest-rank estimate from forty observations, not a precise long-term tail metric. Network variation and shared-server activity can affect it.
6. Add resource evidence before tuning
For a repeat test, sample CPU utilization, iowait, free memory, swap activity, FPM queues and active database work throughout the phases. Private FPM status and slow logs can help locate queueing. Keep diagnostic endpoints private and redact logs before sharing.
If latency rises with CPU saturation, more FPM workers may worsen contention. If queries dominate, inspect SQL plans. If the client itself is saturated, the generator may be the limit. These conclusions need measurements; this run does not establish them.
7. Repeat a representative workload
Use the same test after one targeted change. Include realistic page mixes, authenticated workflows under controlled accounts, writes in a disposable environment and sustained runs appropriate to your service. Measure errors and content correctness alongside latency.
Test anonymous cache HIT and uncached behavior separately. A fast cached homepage cannot prove that private or dynamic pages perform well. Never increase a pool limit solely because a cached benchmark looks good.
8. Preserve results and restore experimental changes
Keep raw request outcomes, timing definitions and configuration snapshots. Remove only your own disposable fixtures when no longer needed. Retain rollback copies for settings changed during earlier tests. This load run itself changed no server configuration or website content.
Use the baseline guide, the measured PHP-FPM pool guide and the database index test as a repeatable series. Present the workload and its limits whenever quoting performance numbers.
Environment: two-CPU shared Ubuntu VPS, aaPanel Free 8.0.7, Nginx, WordPress and PHP 8.5. The tested FPM pool had a maximum of eight children and OPcache enabled. Existing FastCGI cache rules bypassed query-string requests. The generator ran on a separate Windows machine.
1. Choose a safe target and scope
Use a lab server you control. Choose a harmless GET endpoint and a finite request count. Exclude actions that create accounts, orders, mail or database writes. Agree a maintenance window for production testing and monitor other services sharing the machine.
Our target was the WordPress homepage with a unique test query on each request. We verified the query rule returned Nginx-Cache: BYPASS before the run. This measures an uncached homepage path, not checkout, search, login or an entire browsing session.
2. Record the baseline and configuration
Write down PHP version, FPM worker limits, cache states, database version and application version/plugins. Keep those constant between phases. Record server memory, swap and CPU before testing; arrange an interval resource sampler if you need to locate saturation.
This run did not collect a simultaneous server resource trace. We therefore report response results without claiming whether PHP, CPU or SQL limited throughput.
3. Set explicit limits and stop conditions
Our client used 40 requests per phase at concurrency 2, then 4, then 8. Each curl request had a 15-second maximum time, used normal HTTPS certificate validation and performed no retries. Later phases would stop if any request failed or the sample p95 time to first byte exceeded five seconds.
A short request count bounds the total work but can miss sustained bottlenecks. Avoid unbounded loops and high concurrency simply to generate a dramatic result. Watch availability and stop manually if important services degrade.
4. Understand the client measurements
A single request example is:
Code:
curl.exe -sS --max-time 15 -o NUL \
  -w "%{http_code} %{time_starttransfer} %{time_total}" \
"https://example.com/?load_test=unique_value"Time to first byte includes client-side connection and network effects as well as server waiting. Total time includes body transfer. An HTTP 200 alone does not prove the content is correct; separately inspect a sample response for application errors.
We used a bounded client worker pool to run the finite requests concurrently, waited for each phase to complete, then calculated its results. These are closed-loop tests: workers submit another request after the previous one finishes, rather than maintaining a fixed independent arrival rate.
5. Read the actual results
AdminsForum formatted transcript of the original client test, not a screenshot.
- Concurrency 2: 40/40 HTTP 200; median TTFB 295ms; sample p95 334ms; phase elapsed 8.46 seconds; about 4.73 completed requests/second.
- Concurrency 4: 40/40 HTTP 200; median TTFB 334ms; sample p95 431ms; phase elapsed 4.91 seconds; about 8.15 completed requests/second.
- Concurrency 8: 40/40 HTTP 200; median TTFB 377ms; sample p95 609ms; phase elapsed 2.88 seconds; about 13.87 completed requests/second.
The sample p95 is a nearest-rank estimate from forty observations, not a precise long-term tail metric. Network variation and shared-server activity can affect it.
6. Add resource evidence before tuning
For a repeat test, sample CPU utilization, iowait, free memory, swap activity, FPM queues and active database work throughout the phases. Private FPM status and slow logs can help locate queueing. Keep diagnostic endpoints private and redact logs before sharing.
If latency rises with CPU saturation, more FPM workers may worsen contention. If queries dominate, inspect SQL plans. If the client itself is saturated, the generator may be the limit. These conclusions need measurements; this run does not establish them.
7. Repeat a representative workload
Use the same test after one targeted change. Include realistic page mixes, authenticated workflows under controlled accounts, writes in a disposable environment and sustained runs appropriate to your service. Measure errors and content correctness alongside latency.
Test anonymous cache HIT and uncached behavior separately. A fast cached homepage cannot prove that private or dynamic pages perform well. Never increase a pool limit solely because a cached benchmark looks good.
8. Preserve results and restore experimental changes
Keep raw request outcomes, timing definitions and configuration snapshots. Remove only your own disposable fixtures when no longer needed. Retain rollback copies for settings changed during earlier tests. This load run itself changed no server configuration or website content.
Use the baseline guide, the measured PHP-FPM pool guide and the database index test as a repeatable series. Present the workload and its limits whenever quoting performance numbers.