



10-16-2026, 06:23 AM
When a CloudPanel server becomes slow, find the resource under pressure before increasing PHP workers or buying more RAM. CPU saturation, database waits, disk activity and memory exhaustion need different fixes.
This is a CloudPanel v2 diagnostic guide checked against the references below. The branded image illustrates the workflow; no new production load test or lab outage is claimed. Commands are read-only unless a change is explicitly discussed.
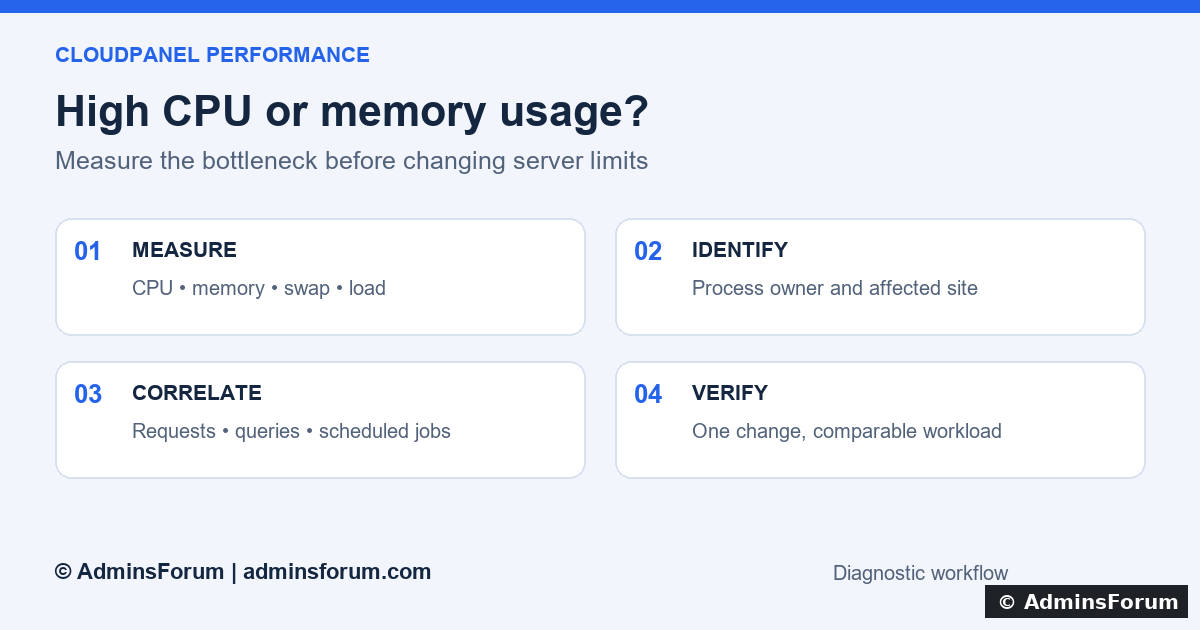
AdminsForum performance workflow: measure, identify the owner, correlate the workload, then compare after one change.
1. Record when the slowdown happens
Note the time and timezone, affected URLs, recent deployments and whether one site or every site is slow. Compare the same interval with the server's monitoring graphs. A scheduled backup, import or traffic burst can explain a brief peak. Repeated peaks at the same minute suggest a scheduled job worth investigating.
Use SSH on the affected server for these checks. Do not run a benchmark against a live site while it is already struggling. Keep process output and logs private: command arguments, URLs and SQL can contain sensitive information.
2. Take a short system snapshot
The commands show the timestamp, load averages, available processing units, memory, short interval activity and live processes. In top, press P to sort by CPU, M to sort by resident memory, and q to exit.
Read the results together:
3. Identify the busy process and site
The first list highlights CPU consumers; the second highlights resident memory. RSS is reported in KiB by this ps format. Process CPU percentages here are not a replacement for top's interval observations, and adding RSS across processes can double-count shared memory.
Match the operating-system user to the affected CloudPanel site's site user. A PHP-FPM pool label can help identify its site. A shared database service can serve several websites, so its high CPU does not identify the responsible website by itself. For a specific PID, inspect its command locally:
Replace 1234 with an observed PID. Do not post that output publicly without redacting secrets. If an unknown process is consuming resources, investigate its owner and origin rather than assuming every busy process is legitimate.
4. If PHP-FPM is busy, trace the requests
Open the affected site's Logs area and compare Nginx and PHP entries around the recorded time. Look for repeated expensive endpoints, PHP errors and pool warnings. A max_children warning means the pool reached its concurrency limit; it does not explain why requests stayed busy.
For sustained PHP CPU, investigate application code, plugins, imports and repeated uncached requests. For workers that wait, investigate database locks or slow external APIs. A private, temporary PHP-FPM slow log can help locate the executing PHP stack when configured for the correct pool. Its request_slowlog_timeout and slowlog settings belong to that pool; protect the output and disable temporary diagnostics after investigation.
Do not copy a universal pm.max_children value from another server. It caps simultaneous requests and must fit the memory budget remaining after the OS, database, caches and other pools. More workers can increase contention or trigger memory exhaustion. PHP memory_limit is not a reliable measurement of each worker's complete resident memory.
5. If MySQL is busy, inspect active work
Connect with an authorized account using a password prompt, then inspect:
Look for repeated long-running statements, the database involved and wait states. Visibility depends on privileges: an application account normally cannot inspect everyone else's sessions. A long Time value on a sleeping connection is not the same as a long-running query. Query text can contain private data; keep it out of screenshots and public replies.
A process list is only a momentary view. For recurring incidents, collect evidence using the database's documented slow-query or performance instrumentation under an appropriate administrator. Review expensive statements and their execution plans before proposing indexes. Do not kill arbitrary connections, increase all database buffers or grant the website a privileged account as a performance shortcut.
If the website reports connection failures as well, follow our CloudPanel database connection guide.
6. Check traffic, cache behavior and scheduled jobs
Use the site's access log around the incident time to identify repeated paths, error responses and traffic bursts. A busy address may be a shared proxy, and a User-Agent can be forged. If traffic passes through a CDN, verify trusted real-IP handling before drawing conclusions about client addresses.
Compare scheduled backup, cron, queue and import times with the load spike. Avoid overlapping heavy jobs. For eligible public pages, verify that the intended cache actually serves hits; authenticated, cart and personalized responses require correct exclusions. Do not cache private pages simply to reduce PHP load. See the existing CloudPanel cron, logs and Varnish guide.
7. Investigate memory exhaustion and storage pressure
Kernel logs can show whether an out-of-memory event killed a process. The filesystem checks show capacity and inode exhaustion, which can prevent logging, uploads and database writes. An empty log search does not rule out a container memory limit or unavailable historical logs.
If memory pressure is confirmed, identify which pool, job or service grew and whether concurrency caused it. Leave headroom instead of allocating all RAM to PHP and MySQL. Do not drop filesystem caches or disable swap as a routine “optimization.” If CPU is mostly waiting on storage, investigate I/O latency with available host monitoring or the provider rather than just adding PHP workers.
8. Make one targeted change and verify
Save the original configuration and choose a maintenance window for changes that interrupt a service. Address the observed cause: optimize the expensive endpoint, fix a query, stagger a heavy job, correct caching, or adjust a measured concurrency budget. Validate configuration before a scoped reload and retain a rollback path.
Compare the same URL and similar traffic before and after. Record response time, errors, CPU, available memory and whether workers still queue. A faster idle homepage does not prove checkout or a heavy report is fixed. Observe the next normal busy period before declaring success. Upgrade resources when measurements show a legitimate workload still exceeds capacity after reasonable tuning.
Useful evidence for support
Provide a redacted timestamped snapshot, affected site, recent change, busiest process owner and matching log messages. State what changed and what improved. Our CloudPanel logs walkthrough explains how to connect a request to its error evidence.
References
Linux top manual · free manual · vmstat manual
PHP-FPM pool configuration
MySQL SHOW PROCESSLIST
This is a CloudPanel v2 diagnostic guide checked against the references below. The branded image illustrates the workflow; no new production load test or lab outage is claimed. Commands are read-only unless a change is explicitly discussed.
AdminsForum performance workflow: measure, identify the owner, correlate the workload, then compare after one change.
1. Record when the slowdown happens
Note the time and timezone, affected URLs, recent deployments and whether one site or every site is slow. Compare the same interval with the server's monitoring graphs. A scheduled backup, import or traffic burst can explain a brief peak. Repeated peaks at the same minute suggest a scheduled job worth investigating.
Use SSH on the affected server for these checks. Do not run a benchmark against a live site while it is already struggling. Keep process output and logs private: command arguments, URLs and SQL can contain sensitive information.
2. Take a short system snapshot
Code:
date -Is
uptime
nproc
free -h
vmstat 1 5
topRead the results together:
- Load average is not a CPU percentage. Compare sustained load with the available CPUs and check whether tasks are running or waiting.
- In free, inspect available memory rather than treating all cache as wasted RAM. Linux uses memory for useful filesystem caching.
- In vmstat, the first report generally summarizes time since boot; use the following interval reports for the current incident. Persistent si/so activity suggests active swapping; swap being allocated alone does not prove a problem.
- Sustained high us/sy CPU time points toward execution pressure. High wa is a clue to investigate storage waits, not proof of one particular faulty disk. High st on a VM may warrant a hosting-provider investigation.
3. Identify the busy process and site
Code:
ps -eo pid,ppid,user,pcpu,pmem,rss,comm --sort=-pcpu | head -n 16
ps -eo pid,ppid,user,pcpu,pmem,rss,comm --sort=-rss | head -n 16Match the operating-system user to the affected CloudPanel site's site user. A PHP-FPM pool label can help identify its site. A shared database service can serve several websites, so its high CPU does not identify the responsible website by itself. For a specific PID, inspect its command locally:
Code:
ps -p 1234 -o pid,ppid,user,etime,args4. If PHP-FPM is busy, trace the requests
Open the affected site's Logs area and compare Nginx and PHP entries around the recorded time. Look for repeated expensive endpoints, PHP errors and pool warnings. A max_children warning means the pool reached its concurrency limit; it does not explain why requests stayed busy.
For sustained PHP CPU, investigate application code, plugins, imports and repeated uncached requests. For workers that wait, investigate database locks or slow external APIs. A private, temporary PHP-FPM slow log can help locate the executing PHP stack when configured for the correct pool. Its request_slowlog_timeout and slowlog settings belong to that pool; protect the output and disable temporary diagnostics after investigation.
Do not copy a universal pm.max_children value from another server. It caps simultaneous requests and must fit the memory budget remaining after the OS, database, caches and other pools. More workers can increase contention or trigger memory exhaustion. PHP memory_limit is not a reliable measurement of each worker's complete resident memory.
5. If MySQL is busy, inspect active work
Connect with an authorized account using a password prompt, then inspect:
Code:
SHOW FULL PROCESSLIST;A process list is only a momentary view. For recurring incidents, collect evidence using the database's documented slow-query or performance instrumentation under an appropriate administrator. Review expensive statements and their execution plans before proposing indexes. Do not kill arbitrary connections, increase all database buffers or grant the website a privileged account as a performance shortcut.
If the website reports connection failures as well, follow our CloudPanel database connection guide.
6. Check traffic, cache behavior and scheduled jobs
Use the site's access log around the incident time to identify repeated paths, error responses and traffic bursts. A busy address may be a shared proxy, and a User-Agent can be forged. If traffic passes through a CDN, verify trusted real-IP handling before drawing conclusions about client addresses.
Compare scheduled backup, cron, queue and import times with the load spike. Avoid overlapping heavy jobs. For eligible public pages, verify that the intended cache actually serves hits; authenticated, cart and personalized responses require correct exclusions. Do not cache private pages simply to reduce PHP load. See the existing CloudPanel cron, logs and Varnish guide.
7. Investigate memory exhaustion and storage pressure
Code:
sudo journalctl -k --since '1 hour ago' --no-pager | grep -Ei 'out of memory|oom|killed process'
df -h
df -iIf memory pressure is confirmed, identify which pool, job or service grew and whether concurrency caused it. Leave headroom instead of allocating all RAM to PHP and MySQL. Do not drop filesystem caches or disable swap as a routine “optimization.” If CPU is mostly waiting on storage, investigate I/O latency with available host monitoring or the provider rather than just adding PHP workers.
8. Make one targeted change and verify
Save the original configuration and choose a maintenance window for changes that interrupt a service. Address the observed cause: optimize the expensive endpoint, fix a query, stagger a heavy job, correct caching, or adjust a measured concurrency budget. Validate configuration before a scoped reload and retain a rollback path.
Compare the same URL and similar traffic before and after. Record response time, errors, CPU, available memory and whether workers still queue. A faster idle homepage does not prove checkout or a heavy report is fixed. Observe the next normal busy period before declaring success. Upgrade resources when measurements show a legitimate workload still exceeds capacity after reasonable tuning.
Useful evidence for support
Provide a redacted timestamped snapshot, affected site, recent change, busiest process owner and matching log messages. State what changed and what improved. Our CloudPanel logs walkthrough explains how to connect a request to its error evidence.
References
Linux top manual · free manual · vmstat manual
PHP-FPM pool configuration
MySQL SHOW PROCESSLIST