



10-13-2026, 02:20 PM
When a website reports a database error, check the database service, connection settings and logs before restarting MySQL or changing passwords. aaPanel's MySQL manager can show the service controls, live status metrics and database error log in one place.
This guide is for MySQL and MariaDB installations managed by aaPanel. A database problem is different from an Nginx or PHP-FPM problem: a working panel login does not prove that every website component is healthy.
What we verified
We inspected aaPanel 8.0.7 on our Ubuntu 22.04 lab on 13 October 2026. The software button was labelled mariadb_10.11.6, while the database startup log reported MariaDB 10.11.10. We also completed a SQL import and saw its two-row table in the database tools.
The Service screen displayed Current state: Stop, yet Current status returned a launch time, connections and database statistics. This is a verified panel-status mismatch, not proof that MariaDB stopped. We did not restart or reinstall the database to make the label change, and we have not confirmed the underlying cause of that mismatch.
1. Identify which layer is failing
Record the exact error, affected website and time. Keep the message private if it contains a username, client IP or application path.
2. Open the database service manager
Go to Databases → MySQL, then click the installed service button above the database list. In our lab it was labelled Mysql mariadb_10.11.6. The same manager can also be reached through the installed MySQL/MariaDB app in App Store.
Select Service. Read the state and available controls. Start, Restart and Reload are actions; do not click them merely to test whether the screen responds.
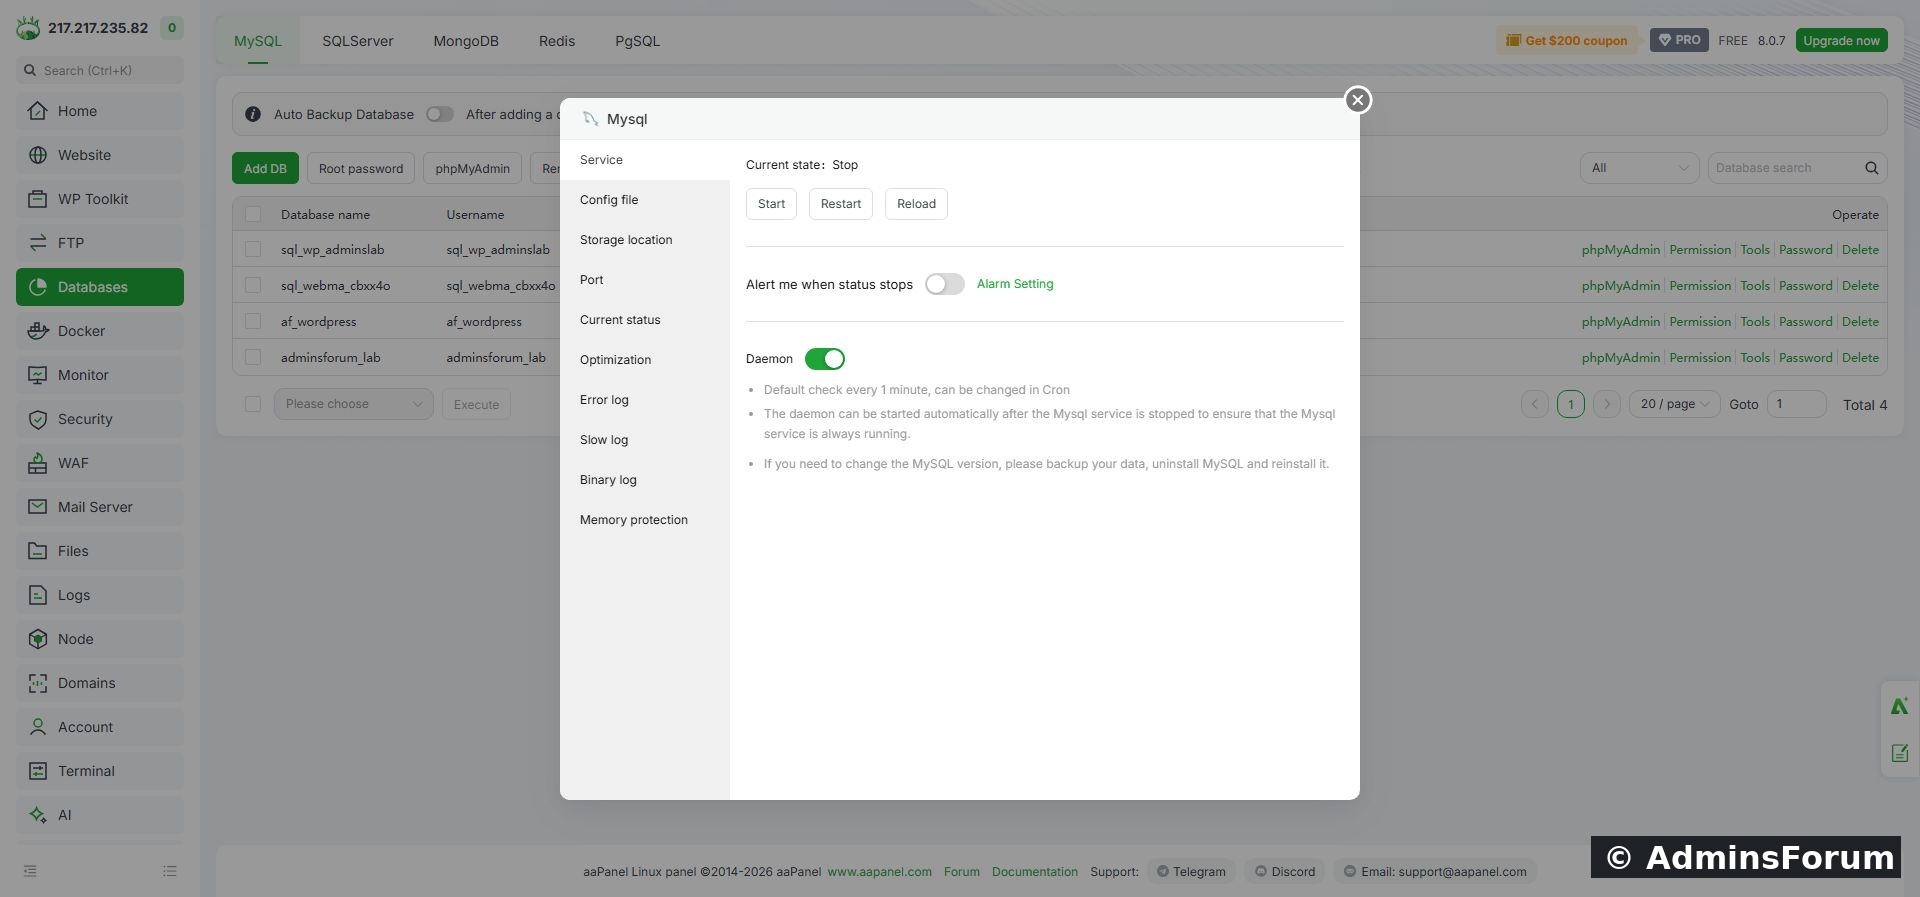
Actual lab screen: the Service label says Stop. The next checks are essential before treating this label as the server's actual state.
If the server is truly stopped, first collect the startup error and identify the reason. A restart can briefly interrupt every application using the service, and repeatedly restarting does not repair an invalid configuration, full disk or corrupted data.
3. Cross-check Current status
Open Current status in the manager. Wait for the figures to load. Note the launch time, connection totals and active connections. A momentary -- or NaN while the screen loads is not a final diagnostic result.
Our screen returned real database metrics after loading, even though the Service tab's label remained Stop. Combined with the successful SQL import, this established that the database was responding to the panel at that time.
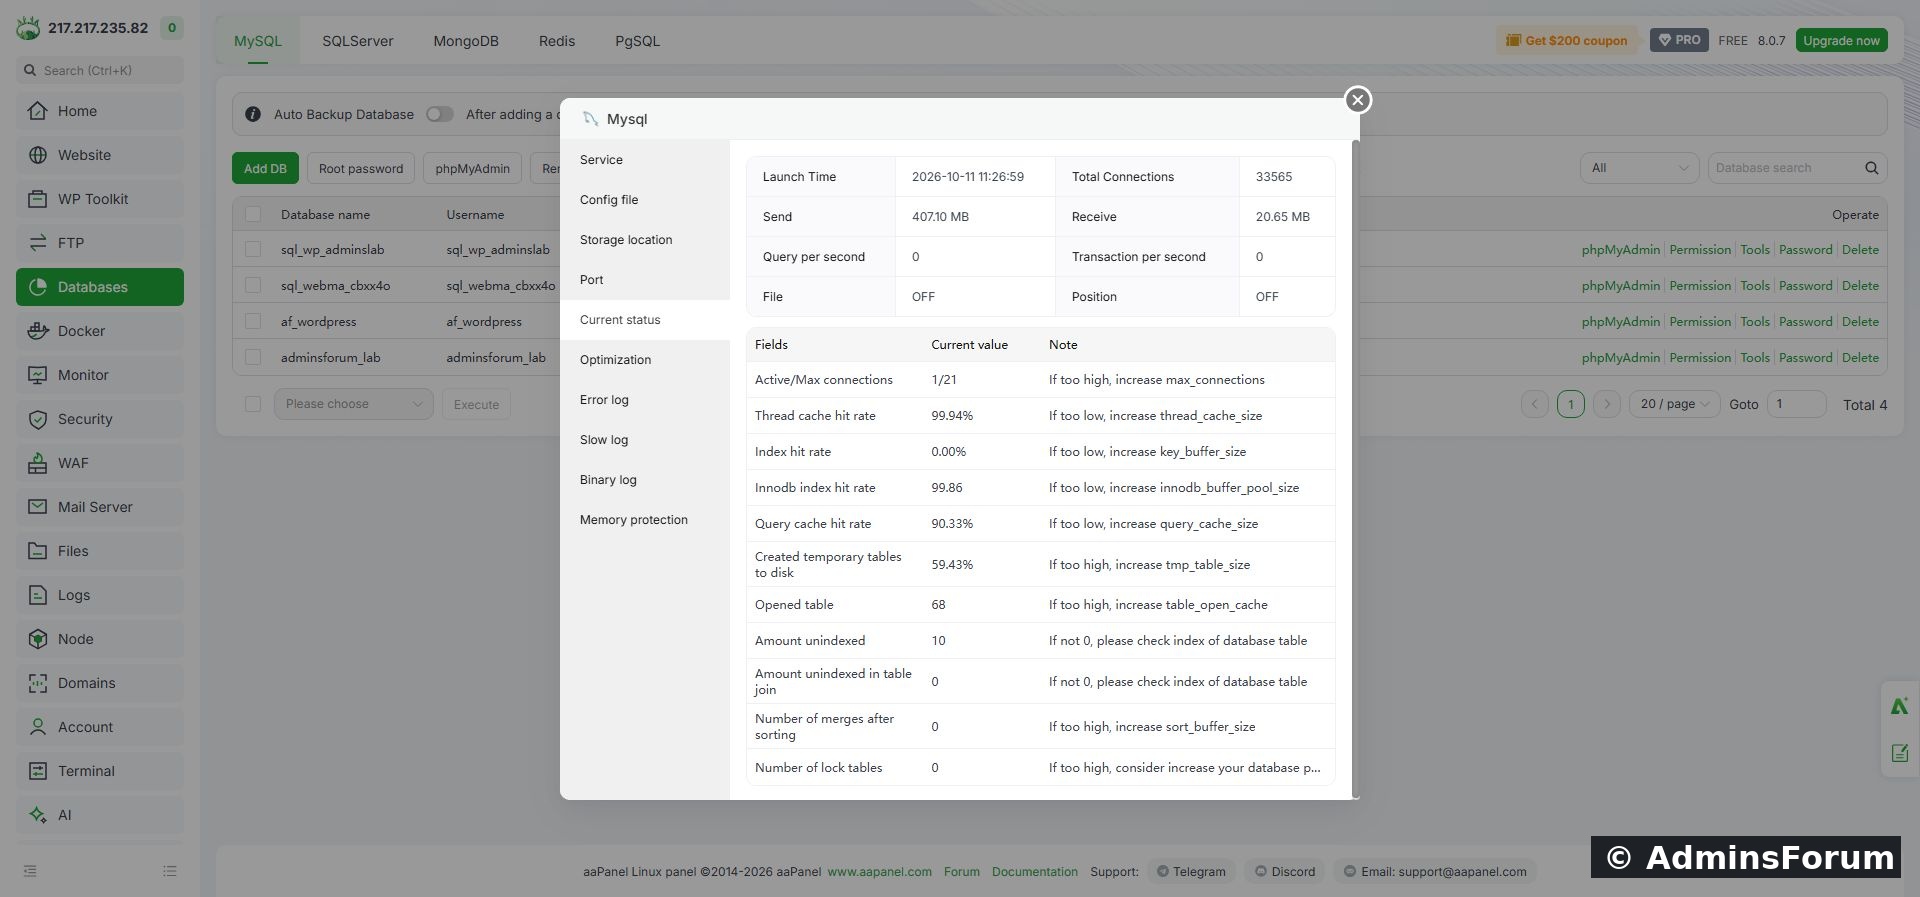
The lab's loaded status metrics. Counters and percentages vary with workload; they are not tuning targets to copy to another server.
Do not increase every memory or cache setting because a panel tip suggests it. An apparently low hit rate can be irrelevant to your engine or workload. For a 4 GB VPS, raising several per-connection buffers can make memory pressure worse.
4. Read Error log
Select Error log. Read the most recent relevant lines and compare their timestamps with the failure time. Server and browser time zones can differ.
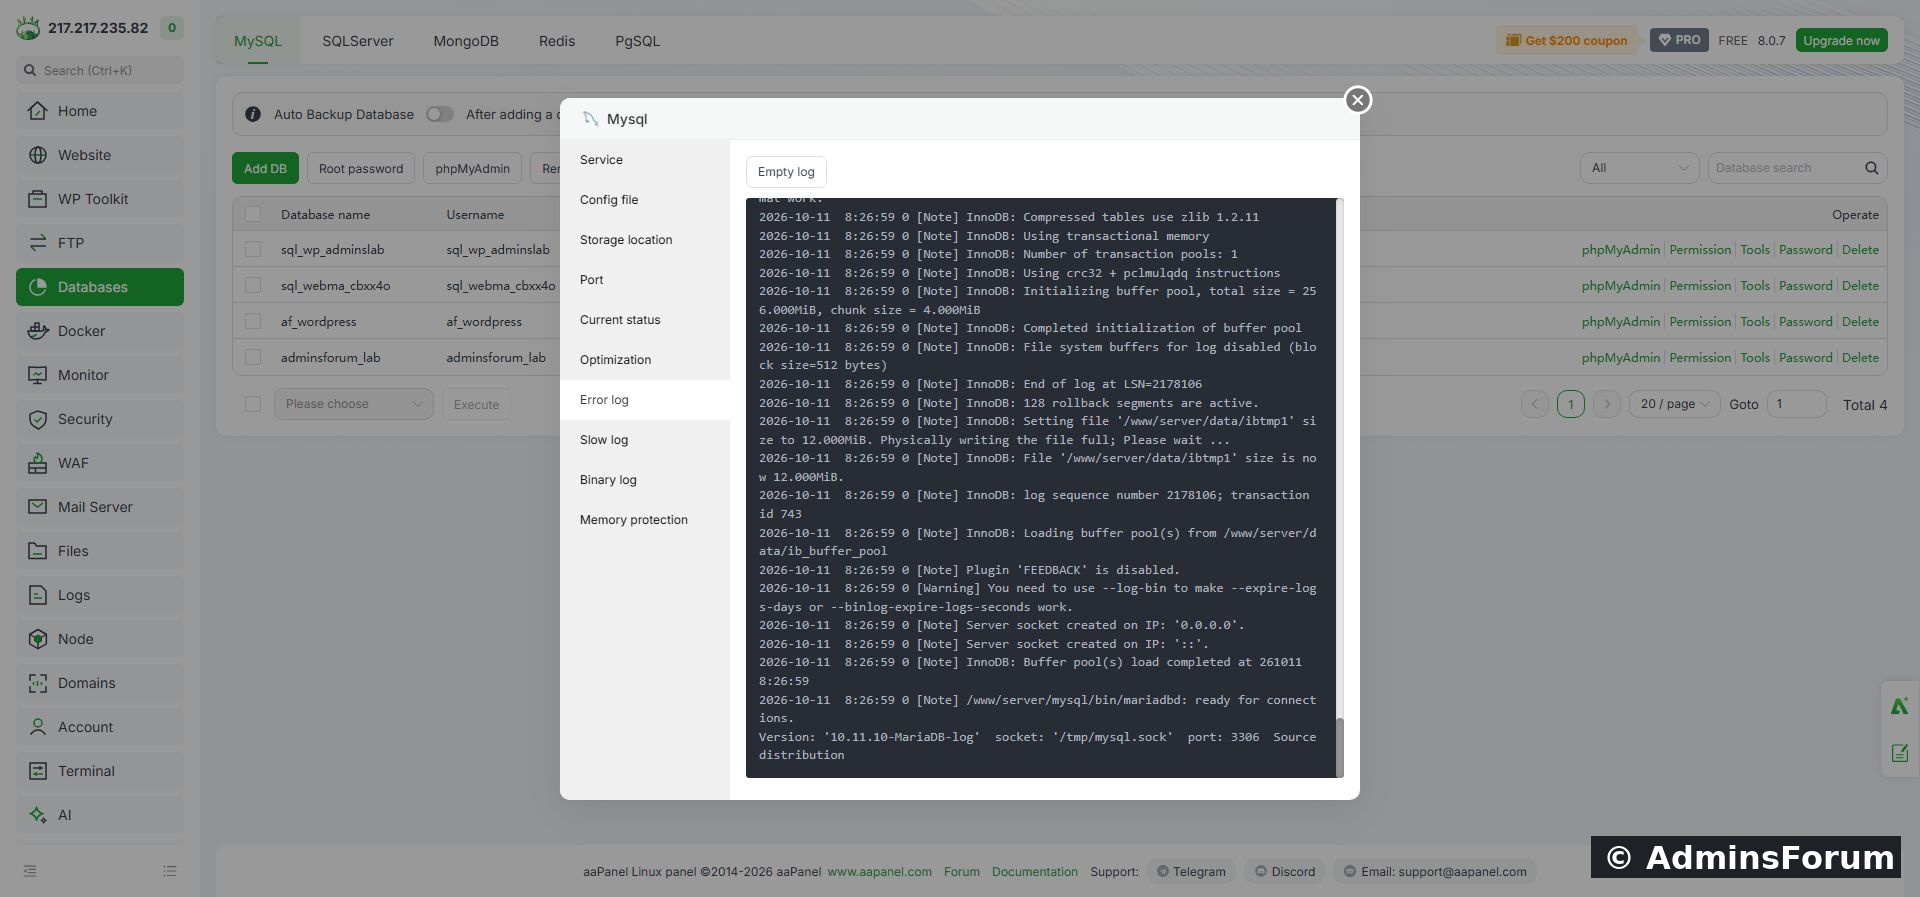
Our log contains startup information and a ready for connections message. That message is historical; the import and Current status checks provide the additional evidence that the lab is responding now.
Pay attention to severity and context:
5. Distinguish a connection problem from a login problem
The exact database-client error helps decide what to check next:
For an application on the same VPS, opening MySQL port 3306 to everyone is not a fix for a wrong local password or database name. Likewise, changing the database root password is not a substitute for correcting a website's own connection settings.
6. Optional checks through SSH
If you already have working SSH access, these read-only checks can help corroborate a misleading panel label:
Use your actual port if it differs from 3306. An open listening port proves that a listener exists; it does not prove that the application can authenticate or query its tables.
A test with the website's own database account is more specific:
The --password option prompts interactively. Do not put a real password directly into a command that may be saved in shell history. This TCP test is different from a localhost Unix-socket connection; use the connection method your application actually requires. The optional SSH commands were not executed in this walkthrough because the lab's browser terminal was not connected.
7. Change one confirmed cause, then verify the website
Back up before a configuration change. Correct the specific failing setting rather than reinstalling the database or deleting files from its data directory. Retest the same connection and a real application page after the change.
If the Service label and successful database queries disagree, report the evidence to aaPanel support: panel version, engine version from the server/log, state screenshot, Current status and the outcome of a harmless query. A hostname/PID-file or process-detection issue is a possibility to investigate, not a cause we have proved on this lab.
Related guides:
Import a SQL Database File in aaPanel
Fix 502 Bad Gateway and 503 Errors in aaPanel
References:
aaPanel MySQL manager
aaPanel service-management commands
MariaDB connection troubleshooting
This guide is for MySQL and MariaDB installations managed by aaPanel. A database problem is different from an Nginx or PHP-FPM problem: a working panel login does not prove that every website component is healthy.
What we verified
We inspected aaPanel 8.0.7 on our Ubuntu 22.04 lab on 13 October 2026. The software button was labelled mariadb_10.11.6, while the database startup log reported MariaDB 10.11.10. We also completed a SQL import and saw its two-row table in the database tools.
The Service screen displayed Current state: Stop, yet Current status returned a launch time, connections and database statistics. This is a verified panel-status mismatch, not proof that MariaDB stopped. We did not restart or reinstall the database to make the label change, and we have not confirmed the underlying cause of that mismatch.
1. Identify which layer is failing
Record the exact error, affected website and time. Keep the message private if it contains a username, client IP or application path.
- A database connection error in the application: check its database host, database name, username and password, as well as service availability.
- An import error: use the Import dialog's Show Logs output. A failed SQL statement may leave a partially imported database.
- 502 or 503 from the web server: inspect the web server/PHP path too. Those HTTP errors do not, by themselves, identify a broken database.
2. Open the database service manager
Go to Databases → MySQL, then click the installed service button above the database list. In our lab it was labelled Mysql mariadb_10.11.6. The same manager can also be reached through the installed MySQL/MariaDB app in App Store.
Select Service. Read the state and available controls. Start, Restart and Reload are actions; do not click them merely to test whether the screen responds.
Actual lab screen: the Service label says Stop. The next checks are essential before treating this label as the server's actual state.
If the server is truly stopped, first collect the startup error and identify the reason. A restart can briefly interrupt every application using the service, and repeatedly restarting does not repair an invalid configuration, full disk or corrupted data.
3. Cross-check Current status
Open Current status in the manager. Wait for the figures to load. Note the launch time, connection totals and active connections. A momentary -- or NaN while the screen loads is not a final diagnostic result.
Our screen returned real database metrics after loading, even though the Service tab's label remained Stop. Combined with the successful SQL import, this established that the database was responding to the panel at that time.
The lab's loaded status metrics. Counters and percentages vary with workload; they are not tuning targets to copy to another server.
Do not increase every memory or cache setting because a panel tip suggests it. An apparently low hit rate can be irrelevant to your engine or workload. For a 4 GB VPS, raising several per-connection buffers can make memory pressure worse.
4. Read Error log
Select Error log. Read the most recent relevant lines and compare their timestamps with the failure time. Server and browser time zones can differ.
Our log contains startup information and a ready for connections message. That message is historical; the import and Current status checks provide the additional evidence that the lab is responding now.
Pay attention to severity and context:
- Note: often normal startup or background information. Our log's FEEDBACK plugin disabled note was not evidence of a stopped database.
- Warning: something to review, not automatically a fatal error. Our binary-log retention warning did not prevent the sample import.
- Error: investigate the named file, setting or resource and the lines immediately around it.
5. Distinguish a connection problem from a login problem
The exact database-client error helps decide what to check next:
- 2002 or 2003, cannot connect: verify the service and the configured host, port or Unix socket. A running service may still be listening somewhere different from the client's settings.
- 1045, access denied for user: review the username, password and allowed host/account permissions. The root, aaPanel login and website database passwords are separate credentials.
- 1044, access denied to a database: check that the application account is permitted to use the requested database.
- 1049, unknown database: compare the configured database name with the database list and confirm that creation or migration completed.
For an application on the same VPS, opening MySQL port 3306 to everyone is not a fix for a wrong local password or database name. Likewise, changing the database root password is not a substitute for correcting a website's own connection settings.
6. Optional checks through SSH
If you already have working SSH access, these read-only checks can help corroborate a misleading panel label:
Code:
/etc/init.d/mysqld status
ss -lntp | grep ':3306'
ls -lh /www/server/data/*.errA test with the website's own database account is more specific:
Code:
/www/server/mysql/bin/mysql --protocol=TCP --host=127.0.0.1 --port=3306 --user=YOUR_DATABASE_USER --password YOUR_DATABASE_NAME -e "SELECT 1;"7. Change one confirmed cause, then verify the website
Back up before a configuration change. Correct the specific failing setting rather than reinstalling the database or deleting files from its data directory. Retest the same connection and a real application page after the change.
If the Service label and successful database queries disagree, report the evidence to aaPanel support: panel version, engine version from the server/log, state screenshot, Current status and the outcome of a harmless query. A hostname/PID-file or process-detection issue is a possibility to investigate, not a cause we have proved on this lab.
Related guides:
Import a SQL Database File in aaPanel
Fix 502 Bad Gateway and 503 Errors in aaPanel
References:
aaPanel MySQL manager
aaPanel service-management commands
MariaDB connection troubleshooting