



A CloudPanel 504 Gateway Timeout means a gateway waited too long for the next server in the request chain. Identify which hop timed out and why before increasing a timeout or adding PHP workers.
This CloudPanel v2 diagnostic walkthrough is based on the official documentation. The branded image is a workflow illustration, not evidence of a newly induced outage. Paths, service names and timeout values below must be matched to your installation.
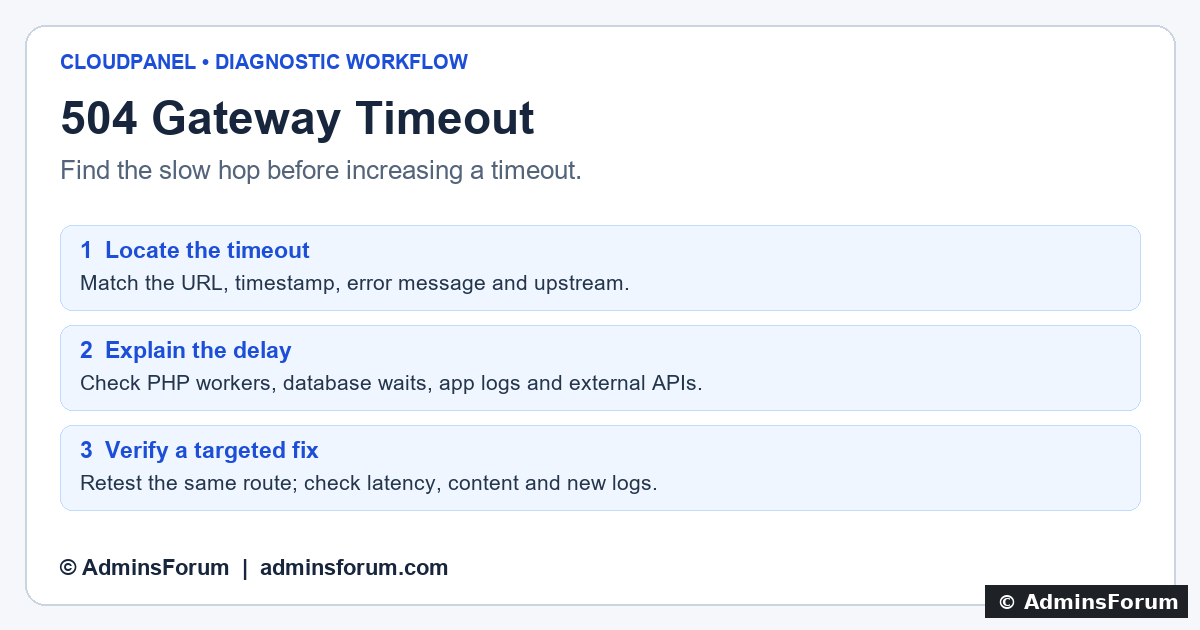
AdminsForum troubleshooting workflow: locate the timeout, explain the delay, then verify recovery.
1. Capture the slow request
Record the exact URL, HTTP status, time with timezone and approximate time spent waiting. Note recent changes, whether all sites fail, and whether only one operation such as search or report generation is affected. Repeat a harmless public request once. Do not repeatedly submit payments, imports or account changes: the backend may continue after the browser receives an error.
Open Sites → affected site → Logs and click Update after the request. Compare Nginx access/error entries with the PHP or app log at that time. Our CloudPanel logs guide explains the viewer and SSH alternatives.
If a CDN or Varnish is involved, trace the actual chain. A timeout at the outer gateway does not establish that PHP itself timed out. If the origin shows no matching request, investigate the preceding hop, routing and logging before changing PHP settings.
2. Distinguish connection time from response time
Use the wording in the Nginx error log:
3. Measure a harmless URL
On an SSH terminal, replace example.com and the path with your site and a safe GET route:
The output reports connection, first-byte and total elapsed times. First-byte time includes earlier phases; it is not a pure PHP execution measurement. If curl reaches its own 30-second limit, it can exit before the gateway responds: that does not prove a server timeout value is 30 seconds. Use the real log evidence and a justified test limit.
A cached homepage may be fast while an uncached route fails. Test the affected route and compare equivalent requests, including authentication state, without sharing tokens. Do not disable TLS verification to make the test pass.
4. Check PHP-FPM workers and application work
In site Settings, confirm the selected PHP version. SSH's php -v may show another version. Find service names:
If the site uses PHP 8.3 and php8.3-fpm.service is the correct unit, inspect recent messages:
Replace the unit for your server. Look for worker saturation, crashes and messages about pm.max_children. A queue can develop when workers spend too long on requests; raising the worker limit without a memory budget can cause swapping or OOM failures.
Check the application's own log for slow imports, plugins, loops or failed dependencies. PHP-FPM supports request_slowlog_timeout and a slowlog destination for tracing slow requests. Enabling that is an administrator task: choose a private writable path and a measured threshold, back up the pool configuration, test it with the matching FPM binary, and apply during a suitable window. Restore temporary diagnostic settings after collecting evidence. Slow logs can contain sensitive application details.
5. Check database waits and external dependencies
Using an authorized database administration session, a read-only snapshot can help:
This can expose SQL text and user data, so inspect it privately and redact it before sharing. Visibility depends on database permissions. Long queries, lock waits and too many concurrent operations need different fixes. A single idle Sleep connection is not proof of a fault. Do not kill sessions or add indexes merely because a query appears once; establish what it is waiting for and whether it belongs to the failing request.
For remote APIs, check the app's outbound connect/read timeouts, retry count and dependency health. A request that retries several slow API calls can exceed the gateway budget. Move lengthy exports or batch work into a queue/background job where practical; keep the web request responsible for starting or checking the job.
6. Check server pressure
Take a short snapshot rather than changing limits immediately:
In vmstat, compare later samples; its first row generally summarizes activity since boot. Investigate sustained CPU pressure, swapping, disk waits, a full filesystem or exhausted inodes alongside the failing request. Available memory is more useful than treating all cache as wasted RAM. A high load average alone does not distinguish CPU demand from I/O waits.
For Node.js/Python sites, inspect the existing process manager and application logs as the site user. Confirm the configured App Port matches the actual HTTP app listener. Do not send HTTP probes to PHP-FPM's FastCGI listener.
7. Change a timeout only after identifying its layer
8. Verify recovery
Repeat the same harmless route, confirm expected content and status, compare latency and check fresh logs. Test an uncached dynamic route as well as a normal page. Old timeout lines do not disappear when fixed, so use timestamps. If the change does not improve the measured symptom, restore it and continue diagnosis.
For support, provide the site type, OS/CloudPanel/PHP versions, status, elapsed time, exact redacted timeout fragment, failing hop and recent changes. Keep credentials, private query data and tokens out of public logs.
References
Nginx proxy read timeout
Nginx FastCGI read timeout
PHP-FPM slow log and request limits
CloudPanel site settings
This CloudPanel v2 diagnostic walkthrough is based on the official documentation. The branded image is a workflow illustration, not evidence of a newly induced outage. Paths, service names and timeout values below must be matched to your installation.
AdminsForum troubleshooting workflow: locate the timeout, explain the delay, then verify recovery.
1. Capture the slow request
Record the exact URL, HTTP status, time with timezone and approximate time spent waiting. Note recent changes, whether all sites fail, and whether only one operation such as search or report generation is affected. Repeat a harmless public request once. Do not repeatedly submit payments, imports or account changes: the backend may continue after the browser receives an error.
Open Sites → affected site → Logs and click Update after the request. Compare Nginx access/error entries with the PHP or app log at that time. Our CloudPanel logs guide explains the viewer and SSH alternatives.
If a CDN or Varnish is involved, trace the actual chain. A timeout at the outer gateway does not establish that PHP itself timed out. If the origin shows no matching request, investigate the preceding hop, routing and logging before changing PHP settings.
2. Distinguish connection time from response time
Use the wording in the Nginx error log:
- While connecting to upstream: investigate the destination address/port, listener availability, routing, firewall and connection backlog. A long connection delay is different from slow application execution.
- While reading response header from upstream: the next hop did not deliver its response headers in time. Investigate app work, queued workers, database waits and external API calls.
- While reading upstream response: investigate a stalled or slow response stream and the appropriate read timeout.
3. Measure a harmless URL
On an SSH terminal, replace example.com and the path with your site and a safe GET route:
Code:
curl --max-time 30 -sS -o /dev/null -w 'status=%{http_code} connect=%{time_connect}s first_byte=%{time_starttransfer}s total=%{time_total}s' https://example.com/A cached homepage may be fast while an uncached route fails. Test the affected route and compare equivalent requests, including authentication state, without sharing tokens. Do not disable TLS verification to make the test pass.
4. Check PHP-FPM workers and application work
In site Settings, confirm the selected PHP version. SSH's php -v may show another version. Find service names:
Code:
systemctl list-units --type=service --all | grep -Ei 'php.*fpm'Code:
sudo journalctl -u php8.3-fpm.service --since '30 minutes ago' --no-pager -n 100Check the application's own log for slow imports, plugins, loops or failed dependencies. PHP-FPM supports request_slowlog_timeout and a slowlog destination for tracing slow requests. Enabling that is an administrator task: choose a private writable path and a measured threshold, back up the pool configuration, test it with the matching FPM binary, and apply during a suitable window. Restore temporary diagnostic settings after collecting evidence. Slow logs can contain sensitive application details.
5. Check database waits and external dependencies
Using an authorized database administration session, a read-only snapshot can help:
Code:
SHOW FULL PROCESSLIST;For remote APIs, check the app's outbound connect/read timeouts, retry count and dependency health. A request that retries several slow API calls can exceed the gateway budget. Move lengthy exports or batch work into a queue/background job where practical; keep the web request responsible for starting or checking the job.
6. Check server pressure
Take a short snapshot rather than changing limits immediately:
Code:
uptime
free -h
vmstat 1 5
df -h
df -iFor Node.js/Python sites, inspect the existing process manager and application logs as the site user. Confirm the configured App Port matches the actual HTTP app listener. Do not send HTTP probes to PHP-FPM's FastCGI listener.
7. Change a timeout only after identifying its layer
- proxy_read_timeout: applies where Nginx proxies to an HTTP backend using proxy_pass. It controls the idle interval between successive upstream reads, not a guaranteed total request runtime.
- fastcgi_read_timeout: applies at a FastCGI hop using fastcgi_pass. It also measures the interval between reads.
- PHP max_execution_time: is an execution limit with platform-dependent accounting; it is not the same as either Nginx timeout.
- FPM request_terminate_timeout: can end a worker's request and is separate from PHP's execution limit.
8. Verify recovery
Repeat the same harmless route, confirm expected content and status, compare latency and check fresh logs. Test an uncached dynamic route as well as a normal page. Old timeout lines do not disappear when fixed, so use timestamps. If the change does not improve the measured symptom, restore it and continue diagnosis.
For support, provide the site type, OS/CloudPanel/PHP versions, status, elapsed time, exact redacted timeout fragment, failing hop and recent changes. Keep credentials, private query data and tokens out of public logs.
References
Nginx proxy read timeout
Nginx FastCGI read timeout
PHP-FPM slow log and request limits
CloudPanel site settings