



Yesterday, 12:51 PM
Response times tell you that a site slowed down; simultaneous server measurements help explain why. This guide pairs a bounded WordPress traffic test with CPU, memory, swap and I/O observations on an aaPanel lab VPS.
Test environment: aaPanel Free 8.0.7, Ubuntu 22.04.5, two virtual CPUs and about 3.8GiB RAM, with Nginx, WordPress and PHP 8.5. The server also runs database, mail and other lab services. A separate Windows client generated traffic. We changed no server settings for this run.
1. Define the question before generating traffic
Are slow responses accompanied by CPU activity, memory pressure, storage waiting or application queueing? Choose a harmless lab endpoint and collect a baseline. Do not test destructive application actions or run an unlimited traffic loop.
Our test used the WordPress homepage with unique query strings. The existing FastCGI rules bypass query-string requests, verified in the earlier cache guide. A cached anonymous homepage could hide the PHP work we wanted to observe.
Start with the controlled load-test guide for request limits, TLS checks and timing definitions. This follow-up adds simultaneous resource evidence rather than repeating a capacity claim.
2. Capture memory and load snapshots
On the lab server, use a private SSH session:
Record the clock and timezone. The client and server must have reasonably aligned clocks to correlate events. Low free memory alone does not demonstrate a problem; include available memory and swap activity. A load average is also not a direct CPU percentage.
Our MemAvailable snapshots were 2,849,192KiB before and 2,813,252KiB after, approximately 2.72GiB and 2.68GiB. These are two snapshots, not the minimum available memory throughout the run.
3. Start a finite interval sampler
Our existing vmstat utility required no additional package installation. We ran:
This requests one-second updates and a finite count. Keep the output in a private administration session or log, and note the sampler's start/end time. It should overlap the request phases, not run only after the workload finishes.
The first data row includes activity averages since boot. We excluded it from interval summaries. Process and memory columns are snapshots; later activity columns cover the sampling interval. In this run we retained 24 interval rows across the traffic and surrounding idle time.
4. Understand the useful columns
5. Run a bounded client workload
We used 80 requests at concurrency 4, followed by 80 at concurrency 8. Every request used HTTPS with normal certificate validation, a 15-second maximum time and no retry. The run would stop before a later phase if any request failed or its sample p95 TTFB exceeded five seconds.
The generator ran off the VPS, so its local client work did not consume the VPS CPUs being measured. It used a finite worker pool: after one request completed, a worker could submit another. This closed-loop workload does not reproduce every real traffic pattern.
Keep important service health under observation and stop if your lab becomes unstable. Do not increase concurrency just to force a failure.
6. Compare the recorded results
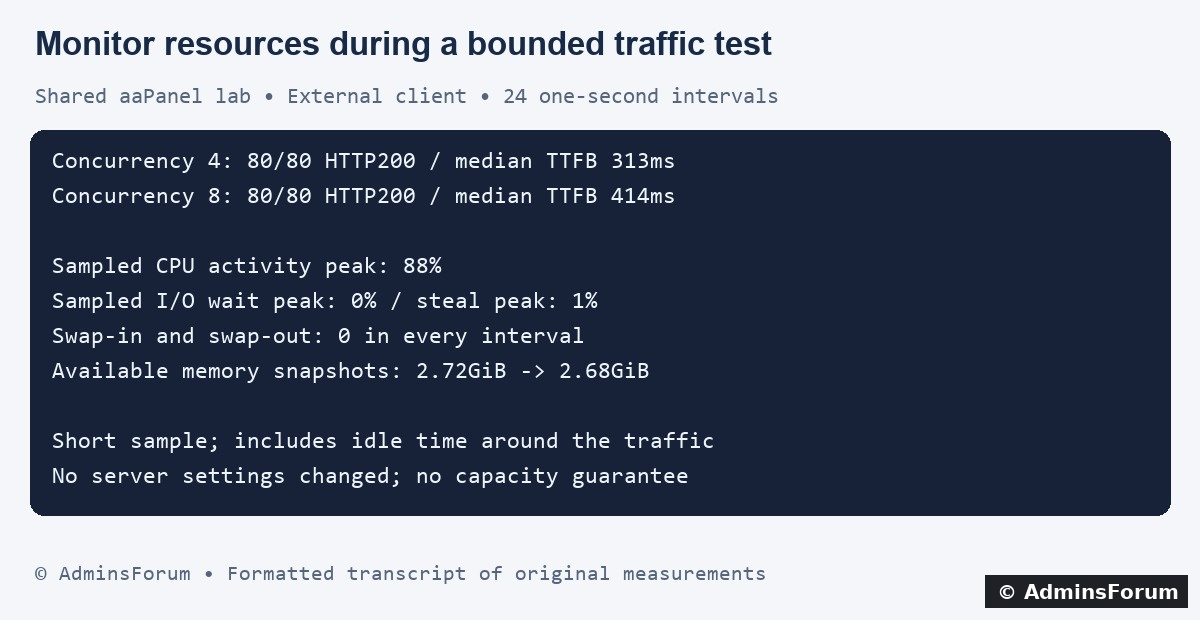
AdminsForum formatted transcript of the original measurements, not a terminal screenshot.
The resource summary includes idle time around the test. Its peak values should not be confused with a phase average. We did not measure FPM queue lengths, individual query timing, per-process CPU attribution or device latency in this run.
7. Form a hypothesis without overstating it
The observations do not show sampled swap pressure or I/O-wait activity. CPU work is a plausible next investigation because activity increased during this request workload. They do not prove that CPU is the only bottleneck or that the VPS can sustain this traffic indefinitely.
For a stronger diagnosis, correlate process CPU, private FPM queue/status observations and application timings with the same request timestamps. Read the PHP slow-log guide to locate executing requests and the database index guide when SQL is implicated.
If storage is suspected, collect device-level latency and queue information as a separate test. A sampled wa value of zero is not proof that every storage operation was instantaneous.
8. Choose the next change from evidence
CPU-heavy PHP work may benefit from application improvements or appropriate caching; adding workers can increase contention. Memory pressure calls for examining actual process use and service budgets. Slow SQL calls for a query plan, not an arbitrary increase to max_connections.
Change one variable, retain a rollback copy and repeat the same workload with the sampler running. Check content correctness and errors as well as speed. HTTP 200 alone cannot establish that an application returned the intended page.
9. Keep the test reproducible
Save phase times, raw request outcomes, resource intervals and configuration versions. Keep logs private and remove secrets before sharing. Use representative authenticated and write workflows only in an appropriate disposable test environment.
This test added no public diagnostic endpoint, altered no application data and left server settings unchanged. Longer runs and realistic workload mixes remain necessary for production planning.
Reference: Ubuntu vmstat manual.
Test environment: aaPanel Free 8.0.7, Ubuntu 22.04.5, two virtual CPUs and about 3.8GiB RAM, with Nginx, WordPress and PHP 8.5. The server also runs database, mail and other lab services. A separate Windows client generated traffic. We changed no server settings for this run.
1. Define the question before generating traffic
Are slow responses accompanied by CPU activity, memory pressure, storage waiting or application queueing? Choose a harmless lab endpoint and collect a baseline. Do not test destructive application actions or run an unlimited traffic loop.
Our test used the WordPress homepage with unique query strings. The existing FastCGI rules bypass query-string requests, verified in the earlier cache guide. A cached anonymous homepage could hide the PHP work we wanted to observe.
Start with the controlled load-test guide for request limits, TLS checks and timing definitions. This follow-up adds simultaneous resource evidence rather than repeating a capacity claim.
2. Capture memory and load snapshots
On the lab server, use a private SSH session:
Code:
date -Is
uptime
free -h
cat /proc/meminfoOur MemAvailable snapshots were 2,849,192KiB before and 2,813,252KiB after, approximately 2.72GiB and 2.68GiB. These are two snapshots, not the minimum available memory throughout the run.
3. Start a finite interval sampler
Our existing vmstat utility required no additional package installation. We ran:
Code:
LC_ALL=C vmstat -n -t 1 25The first data row includes activity averages since boot. We excluded it from interval summaries. Process and memory columns are snapshots; later activity columns cover the sampling interval. In this run we retained 24 interval rows across the traffic and surrounding idle time.
4. Understand the useful columns
- r: runnable work; compare repeated values with the CPU count, not one isolated spike.
- b: work blocked waiting for I/O completion.
- us and sy: user and kernel CPU percentages. Our CPU activity summary used 100 minus idle, I/O wait and steal.
- id, wa and st: idle, I/O-wait and virtual-machine steal percentages; these describe different conditions.
- si and so: swap-in and swap-out activity. Existing swap usage without current transfers is different from sustained swapping.
- bi and bo: block input/output activity. These alone do not identify which disk or application is responsible.
5. Run a bounded client workload
We used 80 requests at concurrency 4, followed by 80 at concurrency 8. Every request used HTTPS with normal certificate validation, a 15-second maximum time and no retry. The run would stop before a later phase if any request failed or its sample p95 TTFB exceeded five seconds.
The generator ran off the VPS, so its local client work did not consume the VPS CPUs being measured. It used a finite worker pool: after one request completed, a worker could submit another. This closed-loop workload does not reproduce every real traffic pattern.
Keep important service health under observation and stop if your lab becomes unstable. Do not increase concurrency just to force a failure.
6. Compare the recorded results
AdminsForum formatted transcript of the original measurements, not a terminal screenshot.
- Concurrency 4: 80/80 HTTP 200, median TTFB 313ms, sample p95 467ms, elapsed phase about 10.20 seconds.
- Concurrency 8: 80/80 HTTP 200, median TTFB 414ms, sample p95 539ms, elapsed phase about 5.76 seconds.
- Across the 24 resource intervals: CPU activity peaked at 88%, I/O wait at 0%, steal at 1%, and runnable work at 6.
- Every interval reported zero swap-in and zero swap-out; available-memory snapshots remained about 2.7GiB.
The resource summary includes idle time around the test. Its peak values should not be confused with a phase average. We did not measure FPM queue lengths, individual query timing, per-process CPU attribution or device latency in this run.
7. Form a hypothesis without overstating it
The observations do not show sampled swap pressure or I/O-wait activity. CPU work is a plausible next investigation because activity increased during this request workload. They do not prove that CPU is the only bottleneck or that the VPS can sustain this traffic indefinitely.
For a stronger diagnosis, correlate process CPU, private FPM queue/status observations and application timings with the same request timestamps. Read the PHP slow-log guide to locate executing requests and the database index guide when SQL is implicated.
If storage is suspected, collect device-level latency and queue information as a separate test. A sampled wa value of zero is not proof that every storage operation was instantaneous.
8. Choose the next change from evidence
CPU-heavy PHP work may benefit from application improvements or appropriate caching; adding workers can increase contention. Memory pressure calls for examining actual process use and service budgets. Slow SQL calls for a query plan, not an arbitrary increase to max_connections.
Change one variable, retain a rollback copy and repeat the same workload with the sampler running. Check content correctness and errors as well as speed. HTTP 200 alone cannot establish that an application returned the intended page.
9. Keep the test reproducible
Save phase times, raw request outcomes, resource intervals and configuration versions. Keep logs private and remove secrets before sharing. Use representative authenticated and write workflows only in an appropriate disposable test environment.
This test added no public diagnostic endpoint, altered no application data and left server settings unchanged. Longer runs and realistic workload mixes remain necessary for production planning.
Reference: Ubuntu vmstat manual.