



Yesterday, 10:32 AM
Before fine-tuning PHP-FPM, SQL or Nginx for a busy website, record a repeatable baseline. Measure response time and errors alongside server resources so later changes can be compared with the same workload.
Series introduction: This lesson records low-load observations on our aaPanel Free 8.0.7 lab. It does not stress-test the server, prove maximum visitor capacity or recommend universal tuning values. PHP-FPM, OPcache, database and caching tuning belong in separate measured lessons.
1. Describe the server and workload
Our lab VPS has two available CPUs, 3.8Gi RAM and a root/data filesystem reporting 39G capacity. Installed components include Nginx 1.30.5 and MariaDB 10.11.10. The PHP 8.5 CLI binary reports 8.5.11; a CLI version alone is not proof of a website's active PHP-FPM runtime.
Record the site's selected PHP version in aaPanel, application version, database implementation, URL, authentication state, cache state and any CDN/proxy. A cached anonymous homepage and a logged-in database-heavy request are different workloads. Identify representative pages before deciding what needs tuning.
2. Check server resources before the sample
From SSH:
Our snapshot showed load averages of 0.32, 0.18 and 0.11, about 2.7Gi available memory, no swap used and 30% disk usage. Those are observations at the time of testing, not permanent operating conditions. See VPS resource checks for interpretation.
For serious performance work, capture CPU, memory, swap and disk-I/O behavior across the same period as the workload. A single before/after snapshot does not establish peak resource use or rule out brief pressure.
3. Measure a normal HTTPS request
On Linux or macOS, a simple diagnostic command is:
On Windows PowerShell use curl.exe and NUL as the output destination. Our test used:
Use a hostname you control and keep normal certificate validation enabled. Check the exit code as well as HTTP status; a timeout or TLS failure should count as a failed request rather than disappearing from the results.
How to read the measurements
4. Repeat a small sequential sample
We sent ten separate sequential requests to the static lab homepage and ten to the WordPress lab homepage, with a short delay between requests. Each request used a fresh curl process. This was a small diagnostic sample, not a concurrent load test.
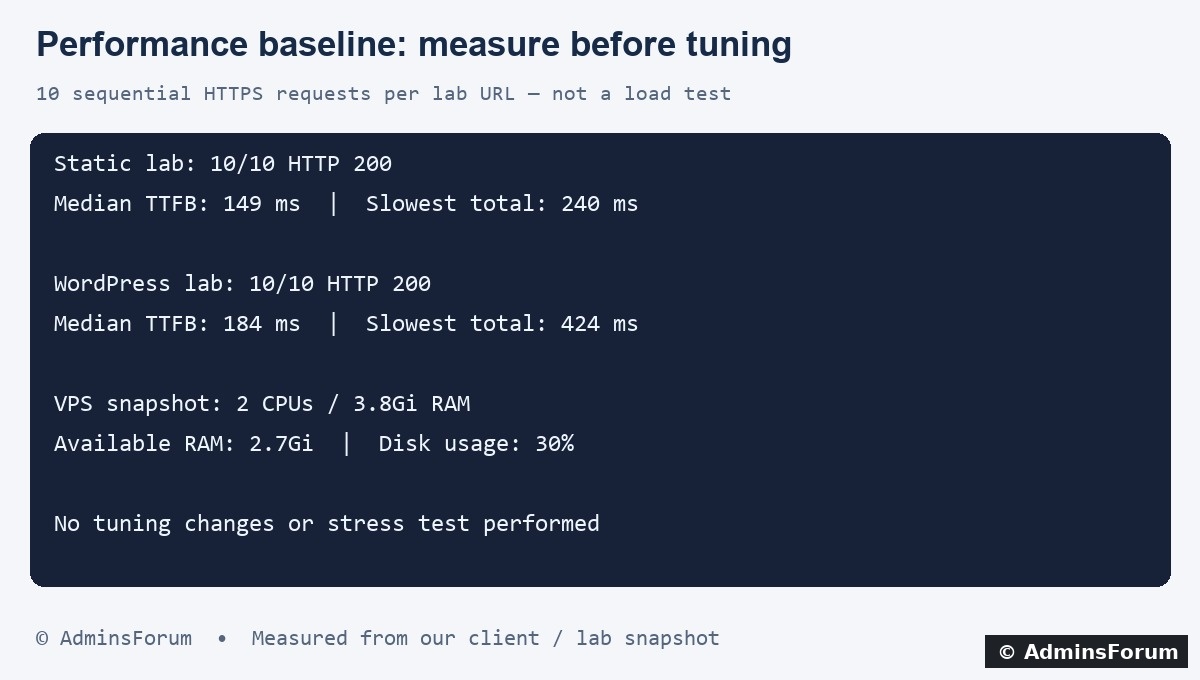
Measured lab results, rounded for readability. The image is a formatted transcript rather than a performance guarantee.
Our client-side results were:
5. Record enough information to repeat the test
Keep the timestamp and timezone, client location, exact URL, request count, whether requests are sequential/concurrent, timeout, status/exit results and software/configuration versions. Note whether the response came from a CDN/cache or the origin if you have verified that distinction.
Repeat from the same client using the same workload when comparing a tuning change. Also test the actual user workflow: anonymous content, logged-in pages, search and writes can have very different costs. Do not combine those outcomes into one unexplained average.
6. Choose the next investigation from evidence
7. Plan a controlled comparison
Back up the exact configuration before editing it. Change one meaningful setting at a time, validate configuration, repeat the same test and compare latency, error rate and resource use. Define rollback conditions before applying changes.
A later controlled load test should use an authorized lab target, bounded duration and concurrency, realistic requests and clear stop conditions. Do not infer requests-per-second capacity or supported monthly visitors from the small sequential sample in this guide.
What this guide verified
Two lab URLs each returned HTTP 200 for ten sequential client requests. We recorded client response timings and a server-resource snapshot. No PHP, database or Nginx tuning, stress test or production configuration change was performed.
AdminsForum performance series, lesson 1: baseline measurement. Later lessons will compare specific changes against documented workloads.
Series introduction: This lesson records low-load observations on our aaPanel Free 8.0.7 lab. It does not stress-test the server, prove maximum visitor capacity or recommend universal tuning values. PHP-FPM, OPcache, database and caching tuning belong in separate measured lessons.
1. Describe the server and workload
Our lab VPS has two available CPUs, 3.8Gi RAM and a root/data filesystem reporting 39G capacity. Installed components include Nginx 1.30.5 and MariaDB 10.11.10. The PHP 8.5 CLI binary reports 8.5.11; a CLI version alone is not proof of a website's active PHP-FPM runtime.
Record the site's selected PHP version in aaPanel, application version, database implementation, URL, authentication state, cache state and any CDN/proxy. A cached anonymous homepage and a logged-in database-heavy request are different workloads. Identify representative pages before deciding what needs tuning.
2. Check server resources before the sample
From SSH:
Code:
nproc
uptime
free -h
df -h /wwwFor serious performance work, capture CPU, memory, swap and disk-I/O behavior across the same period as the workload. A single before/after snapshot does not establish peak resource use or rule out brief pressure.
3. Measure a normal HTTPS request
On Linux or macOS, a simple diagnostic command is:
Code:
curl -sS --max-time 20 -o /dev/null   -w 'HTTP=%{http_code} TTFB=%{time_starttransfer} TOTAL=%{time_total}
' https://your-test-hostname/Code:
curl.exe -sS --max-time 20 -o NUL -w "HTTP=%{http_code} TTFB=%{time_starttransfer} TOTAL=%{time_total}" https://your-test-hostname/How to read the measurements
- HTTP status: check whether the response is expected; a fast error is not a fast successful page.
- TTFB: curl's time_starttransfer is elapsed time until the first response byte, including connection-related work. It is not isolated PHP execution time.
- Total: time until that single response transfer completes. It does not include rendering a browser page or downloading its complete asset graph.
4. Repeat a small sequential sample
We sent ten separate sequential requests to the static lab homepage and ten to the WordPress lab homepage, with a short delay between requests. Each request used a fresh curl process. This was a small diagnostic sample, not a concurrent load test.
Measured lab results, rounded for readability. The image is a formatted transcript rather than a performance guarantee.
Our client-side results were:
- Static lab: 10/10 requests returned HTTP 200. Median TTFB 149 ms; slowest total response 240 ms.
- WordPress lab: 10/10 requests returned HTTP 200. Median TTFB 184 ms; slowest total response 424 ms.
5. Record enough information to repeat the test
Keep the timestamp and timezone, client location, exact URL, request count, whether requests are sequential/concurrent, timeout, status/exit results and software/configuration versions. Note whether the response came from a CDN/cache or the origin if you have verified that distinction.
Repeat from the same client using the same workload when comparing a tuning change. Also test the actual user workflow: anonymous content, logged-in pages, search and writes can have very different costs. Do not combine those outcomes into one unexplained average.
6. Choose the next investigation from evidence
- PHP worker queues or saturation: inspect PHP-FPM status/slow logs and memory per worker before choosing pm.max_children.
- Database-heavy requests: inspect slow queries, query plans, indexes and connection behavior before increasing SQL limits.
- Repeated anonymous content: evaluate page caching with appropriate exclusions for private or changing content.
- High I/O wait: investigate storage and query/file access rather than assuming more PHP workers will help.
- Slow assets/rendering: measure browser/frontend behavior; an origin response test alone cannot explain it.
7. Plan a controlled comparison
Back up the exact configuration before editing it. Change one meaningful setting at a time, validate configuration, repeat the same test and compare latency, error rate and resource use. Define rollback conditions before applying changes.
A later controlled load test should use an authorized lab target, bounded duration and concurrency, realistic requests and clear stop conditions. Do not infer requests-per-second capacity or supported monthly visitors from the small sequential sample in this guide.
What this guide verified
Two lab URLs each returned HTTP 200 for ten sequential client requests. We recorded client response timings and a server-resource snapshot. No PHP, database or Nginx tuning, stress test or production configuration change was performed.
AdminsForum performance series, lesson 1: baseline measurement. Later lessons will compare specific changes against documented workloads.