



To troubleshoot a CloudPanel website, reproduce one failed request, note its time and URL, then compare the Nginx access log, Nginx error log and PHP error log. Match the evidence before changing settings.
This walkthrough uses CloudPanel v2. The screenshot below comes from our existing CloudPanel 2.5.4 / Ubuntu 24.04 lab guide. The log excerpts later in this post are illustrative examples, not fresh incidents on that server.
1. Record the symptom first
Write down the affected domain, exact page, HTTP status, time including timezone, and the last deployment or setting change. Test a public page once; do not repeatedly submit a checkout or other action that can create duplicate transactions. Keep passwords, session cookies and private query strings out of your notes.
2. Open the site's Log Viewer
In CloudPanel, open Sites, choose the affected site and select Logs. Start with NGINX → access.log, choose a suitable line count and click Update. Repeat for the Nginx error log and the PHP error source. Available filenames can vary by installation. The viewer is a recent-lines view, so click Update after reproducing the request.
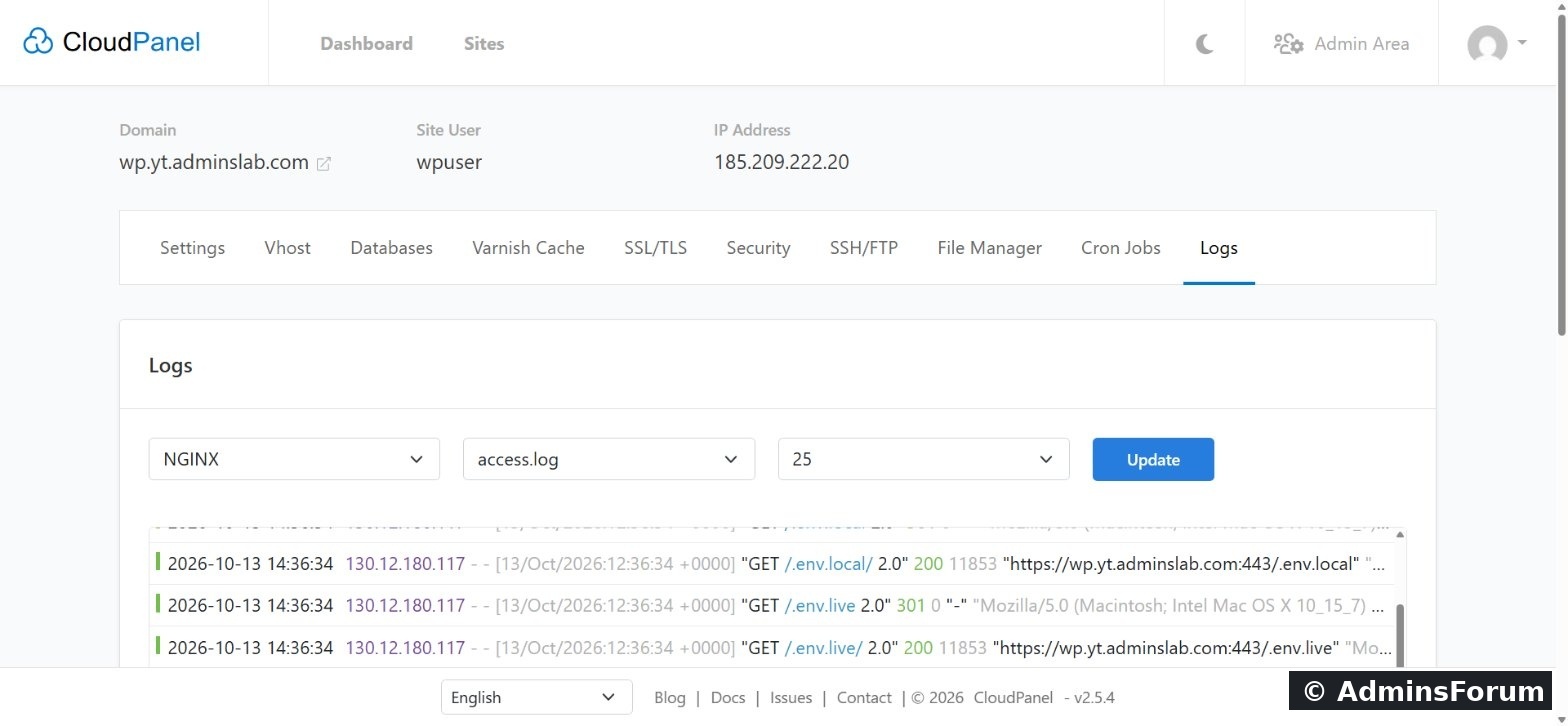
Our branded lab screenshot: the site's Logs tab, source selector, filename, line count and Update button.
The screenshot contains automated requests for .env paths. A request appearing in the log does not prove a breach. Even a 200 status can be an application's fallback page; check what was returned before concluding that a private file was exposed. Do not paste any discovered secrets into a support thread.
3. Use each log for the right question
4. Read one access-log line
Illustrative combined-format example:
Here /catalog is the requested path, 500 is the response status, and +0000 is the timestamp offset. Formats differ, so do not assume every installation uses the same field positions. Compare the matching minute in the error logs. A browser's local time may differ from the server's log time.
If the request is absent, check the correct domain/site, timezone and log source. A CDN or cache may have served the response without reaching the origin. Also consider DNS pointing to another server, log buffering, rotated logs or a disabled access log. Do not restart services simply because the last 25 lines do not show your request.
5. Find the files over SSH when you need more history
CloudPanel documents the site's log tree under /home/SITE_USER/logs/. Replace SITE_USER with the actual site user shown in CloudPanel. Log in as that site user and list the available files:
Choose the exact path from that output; do not copy a CloudPanel v1 path into a v2 server. To read recent entries, replace the example path below with a real listed file:
To watch that file while you make one test request:
Press Ctrl+C to stop following. This stops the viewer, not the website. Search the current file for a known URL fragment:
No match is a clue, not proof that the request never happened: older entries may be in rotated or compressed files. A permission error means you need the correct site user or help from the server administrator; do not make log folders world-readable.
6. Turn the message into a next check
7. Check a database service failure separately
An administrator with sudo access can identify the service name without changing it:
If the service is mysql.service, inspect a limited window:
Use mariadb.service instead only if that is the unit on your server. Some installations write the detailed error log to a configured file rather than the journal; inspect the database's active log_error setting/configuration instead of assuming one universal pathname. Do not enable a busy general query log as a first troubleshooting step.
8. Verify the fix and keep useful evidence
Save the relevant error lines privately, make one justified change with a rollback plan, repeat the same request and check that the new error no longer appears. Confirm the expected page content as well as the status code. Old log lines remain after a fix; compare new timestamps. Leave public PHP error display disabled and remove temporary debug pages after testing.
For support, share the CloudPanel version, OS, site type, PHP version, exact status, approximate time, recent change and a few redacted matching lines. Remove credentials, tokens, email addresses and visitor IPs where they are unnecessary.
Related walkthrough
CloudPanel Cron Jobs, Logs and Varnish Cache
References
CloudPanel v2 Log Viewer and log directory
Nginx access-log formats and buffering
MySQL error-log destinations
This walkthrough uses CloudPanel v2. The screenshot below comes from our existing CloudPanel 2.5.4 / Ubuntu 24.04 lab guide. The log excerpts later in this post are illustrative examples, not fresh incidents on that server.
1. Record the symptom first
Write down the affected domain, exact page, HTTP status, time including timezone, and the last deployment or setting change. Test a public page once; do not repeatedly submit a checkout or other action that can create duplicate transactions. Keep passwords, session cookies and private query strings out of your notes.
2. Open the site's Log Viewer
In CloudPanel, open Sites, choose the affected site and select Logs. Start with NGINX → access.log, choose a suitable line count and click Update. Repeat for the Nginx error log and the PHP error source. Available filenames can vary by installation. The viewer is a recent-lines view, so click Update after reproducing the request.
Our branded lab screenshot: the site's Logs tab, source selector, filename, line count and Update button.
The screenshot contains automated requests for .env paths. A request appearing in the log does not prove a breach. Even a 200 status can be an application's fallback page; check what was returned before concluding that a private file was exposed. Do not paste any discovered secrets into a support thread.
3. Use each log for the right question
- Nginx access log: Did this request reach this server, and which HTTP status did it return?
- Nginx error log: Did file access, a rewrite, or the connection to PHP/application upstream fail?
- PHP error log: Did the application raise an exception, run out of memory or fail to load a file?
- Database service log: Did MySQL/MariaDB stop, restart or report a server-side failure? This is separate from the site's Nginx/PHP Log Viewer.
4. Read one access-log line
Illustrative combined-format example:
Code:
192.0.2.10 - - [16/Oct/2026:10:20:00 +0000] "GET /catalog HTTP/1.1" 500 842 "-" "ExampleBrowser"If the request is absent, check the correct domain/site, timezone and log source. A CDN or cache may have served the response without reaching the origin. Also consider DNS pointing to another server, log buffering, rotated logs or a disabled access log. Do not restart services simply because the last 25 lines do not show your request.
5. Find the files over SSH when you need more history
CloudPanel documents the site's log tree under /home/SITE_USER/logs/. Replace SITE_USER with the actual site user shown in CloudPanel. Log in as that site user and list the available files:
Code:
find /home/SITE_USER/logs/ -maxdepth 3 -type f -name '*.log' -printCode:
tail -n 100 -- /absolute/path/to/error.logCode:
tail -n 30 -F -- /absolute/path/to/error.logCode:
grep -nF -- '/catalog' /absolute/path/to/access.log | tail -n 206. Turn the message into a next check
- 404 / file not found: Compare the requested path with the document root, deployed files and application routing. A missing favicon is different from a missing homepage.
- Permission denied: Check the named file and parent directory ownership/permissions. Avoid blanket chmod 777 changes.
- PHP Fatal error / Uncaught exception: Follow the named file and line, check the recent code change and the site's PHP version/extensions. A stack trace points to a failure location; it is not automatically the root cause.
- Connection refused while connecting to upstream: Check whether the intended PHP/application service is running and whether its configured listener matches the vhost.
- Upstream timed out: Correlate slow application work, database delays and resource pressure. Increasing timeouts alone can hide the cause.
7. Check a database service failure separately
An administrator with sudo access can identify the service name without changing it:
Code:
systemctl list-units --type=service --all | grep -Ei 'mysql|mariadb'Code:
sudo journalctl -u mysql.service --since '30 minutes ago' --no-pager -n 1008. Verify the fix and keep useful evidence
Save the relevant error lines privately, make one justified change with a rollback plan, repeat the same request and check that the new error no longer appears. Confirm the expected page content as well as the status code. Old log lines remain after a fix; compare new timestamps. Leave public PHP error display disabled and remove temporary debug pages after testing.
For support, share the CloudPanel version, OS, site type, PHP version, exact status, approximate time, recent change and a few redacted matching lines. Remove credentials, tokens, email addresses and visitor IPs where they are unnecessary.
Related walkthrough
CloudPanel Cron Jobs, Logs and Varnish Cache
References
CloudPanel v2 Log Viewer and log directory
Nginx access-log formats and buffering
MySQL error-log destinations