



1 hour ago
A 504 Gateway Timeout means a gateway did not receive a timely response from its upstream. The useful next step is to identify which gateway timed out and what it was waiting for. A slow SQL query, external API, busy PHP worker pool or an unreachable upstream can require very different fixes.
This guide uses an isolated Nginx HTTP-proxy experiment, then shows how to investigate a real aaPanel website. The tested values below are deliberately tiny lab settings, not recommended production limits.
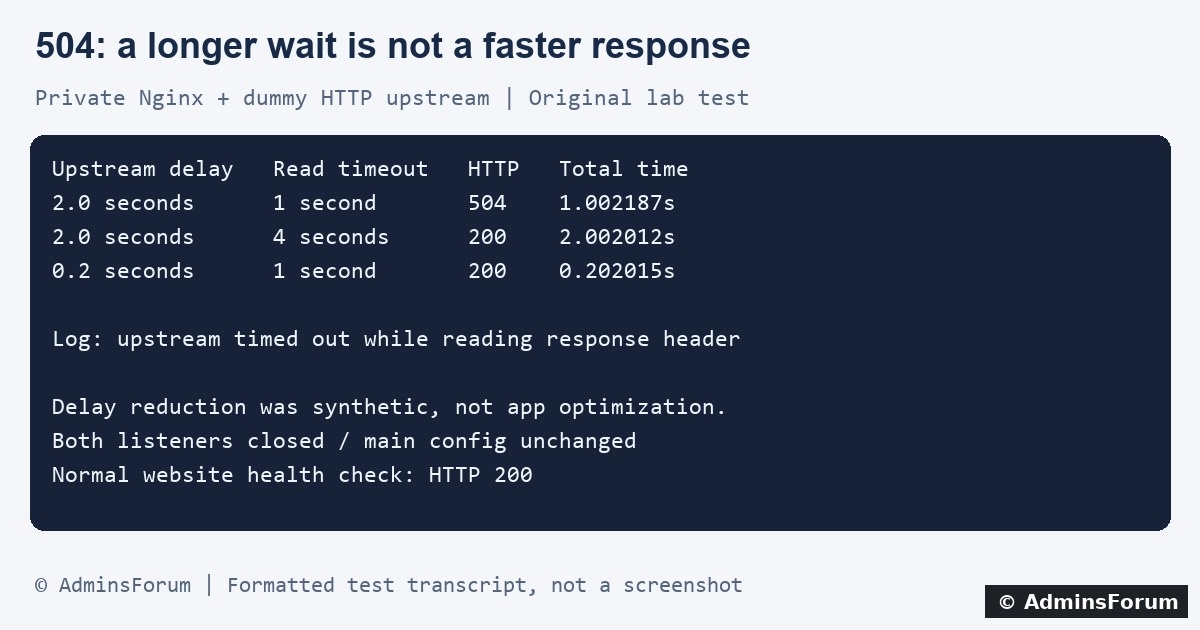
AdminsForum original lab results, presented as a formatted transcript rather than a screenshot.
1. Record the failing request before changing settings
Write down the exact time and timezone, domain, path, action and approximate waiting time. Does one report page fail, or every page? Does it fail only during traffic peaks? Avoid repeatedly submitting payments, imports or other actions that might continue on the server after the browser gives up.
Check whether the response comes from your origin Nginx, another reverse proxy or a CDN. A branded error page is a clue, not conclusive proof of which layer caused the delay. Match the request against origin logs. Do not disable your firewall or expose a private origin to diagnose this.
2. Find the matching website logs in aaPanel
Open Website → PHP Project, locate the affected site and use its Log control. Inspect Access log and Error log around the recorded time. Refresh the viewer and expand the displayed line count if necessary. Panel layouts differ by version.
On our lab site the files are:
Replace the domain with your own site's actual configured log path. A bounded SSH check is:
Do not paste complete logs publicly: redact tokens, private query strings, addresses and customer information. A browser 504 with no matching origin request may point to an earlier proxy layer or the wrong log file.
3. Read the upstream error, not just the status code
Our failing request produced this shortened error:
Here Nginx was waiting for the upstream response header. A message about connecting to the upstream points to a different phase: check the upstream address, listener, route and service health. A connection refusal often leads to 502 instead; do not treat every gateway failure as the same problem.
The error line's upstream field helps distinguish HTTP proxying from FastCGI. Correlate the path and timestamp with the application log and, for PHP, its slow log. A 504 alone does not prove that MySQL, PHP or Nginx needs a larger limit.
4. Understand the two common read-timeout settings
These are illustrative directives, not instructions to add both. Identify the active location and included configuration first. Do not create a second conflicting location block or edit a shared PHP include without understanding every affected site.
Nginx read timeouts measure the allowed gap between successive reads from the upstream; they are not a universal total request duration limit. Connection timeouts govern another phase. PHP execution limits, PHP-FPM termination limits and CDN or load-balancer limits are separate and may end the request sooner.
5. What our isolated test actually demonstrated
The lab used the installed Nginx 1.30.5 binary, a separate configuration and two loopback-only listeners. Its dummy HTTP upstream deliberately waited before returning a response. There were only three measured requests:
6. Investigate what the real application is waiting for
7. If a timeout adjustment is justified, make it deliberately
Back up the affected site's configuration. Record the old value, the expected operation duration and the limits of every proxy in front of it. In aaPanel open the affected site's configuration and locate the active proxy or FastCGI section. Change only the appropriate directive in the intended scope, then run the panel's configuration validation before applying or reloading it. Restore the backup if validation fails.
Do not copy the lab's 1-second or 4-second settings to your website. Choose a finite budget based on a legitimate request and measured behavior. A larger budget is sometimes appropriate, but it also permits longer resource occupancy and does not repair slow application work.
8. Verify the result and keep a rollback path
Repeat one safe request and compare status, response content and elapsed time. Check the application actually finished; an HTTP 200 alone can contain an application error. Confirm the error log has no new matching upstream timeout, inspect nearby normal pages and monitor resource use. For an intermittent issue, observe a representative traffic period before declaring it fixed.
A simple non-mutating request timing example is:
Use a real, safe URL on your site. curl's own maximum time is a client-side limit, separate from Nginx's upstream timeout. Never include login tokens or secrets in a public command example.
Related troubleshooting guides
Find website access and error logs in aaPanel
Trace slow PHP requests with PHP-FPM slow logs
Investigate MariaDB query plans and indexes
Technical references
Nginx proxy_read_timeout documentation
Nginx fastcgi_read_timeout documentation
This guide uses an isolated Nginx HTTP-proxy experiment, then shows how to investigate a real aaPanel website. The tested values below are deliberately tiny lab settings, not recommended production limits.
AdminsForum original lab results, presented as a formatted transcript rather than a screenshot.
1. Record the failing request before changing settings
Write down the exact time and timezone, domain, path, action and approximate waiting time. Does one report page fail, or every page? Does it fail only during traffic peaks? Avoid repeatedly submitting payments, imports or other actions that might continue on the server after the browser gives up.
Check whether the response comes from your origin Nginx, another reverse proxy or a CDN. A branded error page is a clue, not conclusive proof of which layer caused the delay. Match the request against origin logs. Do not disable your firewall or expose a private origin to diagnose this.
2. Find the matching website logs in aaPanel
Open Website → PHP Project, locate the affected site and use its Log control. Inspect Access log and Error log around the recorded time. Refresh the viewer and expand the displayed line count if necessary. Panel layouts differ by version.
On our lab site the files are:
Code:
/www/wwwlogs/adminslab.com.log
/www/wwwlogs/adminslab.com.error.logCode:
tail -n 100 /www/wwwlogs/example.com.error.log
tail -n 100 /www/wwwlogs/example.com.log3. Read the upstream error, not just the status code
Our failing request produced this shortened error:
Code:
upstream timed out (110: Connection timed out)
while reading response header from upstreamThe error line's upstream field helps distinguish HTTP proxying from FastCGI. Correlate the path and timestamp with the application log and, for PHP, its slow log. A 504 alone does not prove that MySQL, PHP or Nginx needs a larger limit.
4. Understand the two common read-timeout settings
Code:
# HTTP reverse proxy: Node, Python or another HTTP service
proxy_read_timeout 30s;

# FastCGI: commonly a PHP-FPM website
fastcgi_read_timeout 30s;Nginx read timeouts measure the allowed gap between successive reads from the upstream; they are not a universal total request duration limit. Connection timeouts govern another phase. PHP execution limits, PHP-FPM termination limits and CDN or load-balancer limits are separate and may end the request sooner.
5. What our isolated test actually demonstrated
The lab used the installed Nginx 1.30.5 binary, a separate configuration and two loopback-only listeners. Its dummy HTTP upstream deliberately waited before returning a response. There were only three measured requests:
- Delay 2 seconds, read timeout 1 second: 504 in 1.002187 seconds, with an upstream-header timeout in the error log.
- Same 2-second delay, read timeout 4 seconds: 200 in 2.002012 seconds. The longer allowance did not make the upstream faster.
- Artificial delay reduced to 0.2 seconds, original 1-second timeout restored: 200 in 0.202015 seconds.
6. Investigate what the real application is waiting for
- Slow PHP code: correlate a PHP-FPM slow-log stack with the failing URL. Check whether workers are busy or requests are queuing. Raising worker counts beyond available memory can make the situation worse.
- Database work: identify the actual slow query and inspect its plan before adding an index. Check locks and transaction duration. Do not change global database limits based on one gateway error.
- External API: inspect the application's outgoing request timeout and upstream provider status. Use bounded retries and a clear failure response; retries can multiply load.
- Traffic or resource pressure: compare CPU, available memory, swap activity and disk latency with the incident time. A quiet server after the event does not rule out an earlier spike.
- Long exports or imports: consider a background job with status polling and a downloadable result. Increasing web timeouts indefinitely leaves connections and workers occupied.
7. If a timeout adjustment is justified, make it deliberately
Back up the affected site's configuration. Record the old value, the expected operation duration and the limits of every proxy in front of it. In aaPanel open the affected site's configuration and locate the active proxy or FastCGI section. Change only the appropriate directive in the intended scope, then run the panel's configuration validation before applying or reloading it. Restore the backup if validation fails.
Do not copy the lab's 1-second or 4-second settings to your website. Choose a finite budget based on a legitimate request and measured behavior. A larger budget is sometimes appropriate, but it also permits longer resource occupancy and does not repair slow application work.
8. Verify the result and keep a rollback path
Repeat one safe request and compare status, response content and elapsed time. Check the application actually finished; an HTTP 200 alone can contain an application error. Confirm the error log has no new matching upstream timeout, inspect nearby normal pages and monitor resource use. For an intermittent issue, observe a representative traffic period before declaring it fixed.
A simple non-mutating request timing example is:
Code:
curl -sS --max-time 45 -o /dev/null \
  -w 'HTTP %{http_code} | total %{time_total}s\n' \
https://example.com/safe-status-pageRelated troubleshooting guides
Find website access and error logs in aaPanel
Trace slow PHP requests with PHP-FPM slow logs
Investigate MariaDB query plans and indexes
Technical references
Nginx proxy_read_timeout documentation
Nginx fastcgi_read_timeout documentation