



Yesterday, 12:48 PM
Start website troubleshooting by recording the failing request, its time and its HTTP status. Then match that request with the website's access log, error log and application evidence. This guide shows a real missing-file diagnosis in aaPanel and explains where to look for other failures.
Tested: aaPanel Free 8.0.7, Ubuntu 22.04.5 and Nginx 1.30.5. We inspected the native website log viewer, generated one missing-file request, matched its access/error entries and verified a temporary file corrected that request. The test file was removed afterwards. Other error types below are interpretation examples, not deliberately triggered failures.
1. Write down the symptom before changing anything
Record the exact hostname and path, time with timezone, HTTP status, request method, whether all pages fail or one route fails, and the last relevant change. Distinguish a browser connection failure from an HTTP response delivered by a server.
A request may pass through Cloudflare/CDN, Nginx, PHP-FPM and the application. A status code alone does not identify which layer caused it. Avoid restarting every service before collecting the relevant evidence.
For a harmless GET endpoint you control:
Replace the hostname and path. Keep certificate verification enabled. This Linux example shows headers and discards the body; on Windows use curl.exe and NUL. Separately inspect the response content, because HTTP 200 can still contain an application error.
2. Open the website's native aaPanel logs
In our current interface:
Our website access log was /www/wwwlogs/adminslab.com.log; its error log was /www/wwwlogs/adminslab.com.error.log. These are lab paths, not universal names. Confirm the selected website and effective Nginx access_log/error_log directives if the viewer shows no matching entries.
3. Locate the request in the access log
The access log tells you that the server handled a request and records configured fields such as method, path, status and byte count. Our matching entry contained:
The full entry used loopback client 127.0.0.1 because our request came from the server itself. For proxied visitor traffic, an address in a log may identify the proxy unless trusted real-IP handling is configured. Do not treat arbitrary forwarded headers as verified visitor identity.
Match the time, hostname, path and method rather than assuming the latest error belongs to your browser. Check browser/CDN caching and timezone differences when the times seem inconsistent.
4. Match the error log at the same time
At 12:40:54 UTC, our error log reported an open() failure for the expected file under /www/wwwroot/adminslab.com, with error 2: No such file or directory.
This supported a missing-file diagnosis for this static test URL. We created only that temporary file at the expected root path and repeated the request. At 12:41:34 UTC the response was HTTP 200 with the intended test content, and the access log recorded 200.
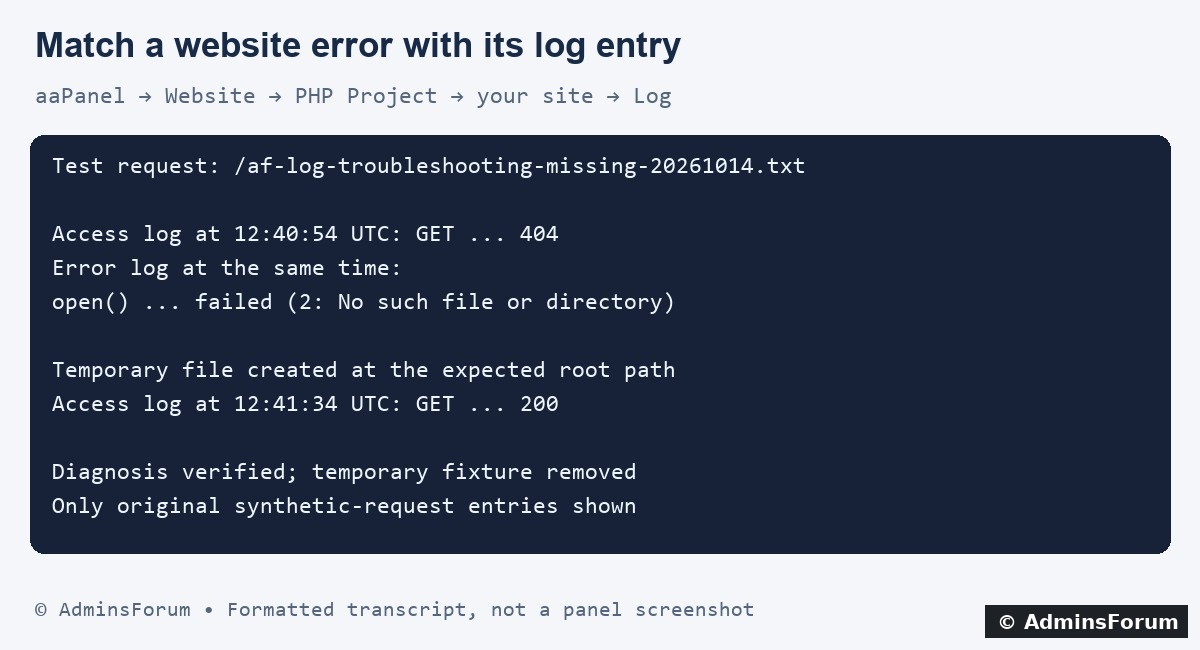
AdminsForum formatted transcript of our synthetic request and matching log entries, not a screenshot. Unrelated visitor entries are excluded.
We removed the fixture after verification. This was a lab demonstration, not a recommendation to create an empty file whenever a route returns 404. An application route may instead require the right document root or rewrite rules. For WordPress pretty URLs, see the permalink 404 guide.
5. Read common messages as clues
6. Know the difference between PHP-FPM and application logs
The lab FPM master error_log was /www/server/php/85/var/log/php-fpm.log. This captures FPM service diagnostics; it is not a guarantee that every PHP application's warning appears there.
A private FPM settings probe confirmed PHP loaded /www/server/php/85/etc/php.ini, with log_errors enabled, display_errors off and no explicit PHP error_log path. An empty PHP error_log value delegates the destination to the SAPI. Inspect the effective runtime, web-server FastCGI error output and application logger rather than assuming a file name.
The CLI runtime can load a different ini file. Never publish phpinfo or stack traces on an unprotected website just to discover a setting. Our probe was outside the web root, used through the private socket and removed afterwards.
PHP slow logs answer a different question: where a long-running worker was executing. Follow the tested slow-log guide for that workflow.
7. Check the application logger
Frameworks and CMS plugins may capture exceptions in their own log location or service journal. Check the application's documented logging configuration and make sure the runtime can write to its intended private directory.
For WordPress, official debug logging supports a chosen file path while display can remain disabled. Use a staging copy and backup before temporary debug changes; do not expose wp-content/debug.log publicly or leave development debugging enabled on a live site. This article did not alter WordPress debug settings.
For a database-related exception, examine the corresponding database evidence and query. A web-server access log usually cannot tell you which SQL statement was slow or failed.
8. Search bounded log output through SSH
If the panel cannot reach an older entry, use the actual private log paths:
Replace example.com and the path with your own. tail -n shows recent lines; grep -F matches literal text; tail -F follows a log and can handle its replacement during rotation. Stop live following with Ctrl+C. For very large files, restrict the time/file range instead of dumping everything.
A rotated log may contain yesterday's evidence. Read the appropriate archive with supported tools; do not clear or delete logs merely to make the view shorter. Preserve useful evidence and maintain deliberate retention.
9. When no matching entry appears
Confirm that the request reached the expected server and virtual host. Check DNS, CDN responses, HTTPS/redirect paths, selected website, enabled logging and rotation. Some locations intentionally suppress logging; absence of an entry does not prove the request never happened.
If the web server cannot start, a per-site access log may be irrelevant. Inspect the server's startup/configuration error and validate the actual panel-managed configuration. For our Nginx installation the syntax check is:
Do not reload an invalid configuration. Retain a backup before a repair and check normal pages after applying it.
10. Verify the fix and ask for help with safe evidence
Change one identified cause, repeat the same request, inspect the new status and content, and confirm the matching fresh log entry. Check a normal page too. An old error remaining in the log does not mean the fix failed: compare timestamps.
When posting support details, include versions, affected path, time/timezone, status, last change and a small redacted matching excerpt. Remove credentials, cookies, tokens, private email addresses, visitor IPs and unrelated user data. Logs are evidence to interpret, not instructions to execute.
References: Nginx beginner's guide, PHP error logging configuration and WordPress debugging documentation.
Tested: aaPanel Free 8.0.7, Ubuntu 22.04.5 and Nginx 1.30.5. We inspected the native website log viewer, generated one missing-file request, matched its access/error entries and verified a temporary file corrected that request. The test file was removed afterwards. Other error types below are interpretation examples, not deliberately triggered failures.
1. Write down the symptom before changing anything
Record the exact hostname and path, time with timezone, HTTP status, request method, whether all pages fail or one route fails, and the last relevant change. Distinguish a browser connection failure from an HTTP response delivered by a server.
A request may pass through Cloudflare/CDN, Nginx, PHP-FPM and the application. A status code alone does not identify which layer caused it. Avoid restarting every service before collecting the relevant evidence.
For a harmless GET endpoint you control:
Code:
curl -sS --max-time 15 -D - -o /dev/null https://example.com/problem-path2. Open the website's native aaPanel logs
In our current interface:
- Open Website and select PHP Project.
- Find the exact site row and click Log.
- The Site modification window provides Access log and Error log views, alongside Response log and Log Security Analysis.
- Use Refresh to retrieve current information. The access view offers recent 50, 100, 500 or All lines and displays the source log path.
Our website access log was /www/wwwlogs/adminslab.com.log; its error log was /www/wwwlogs/adminslab.com.error.log. These are lab paths, not universal names. Confirm the selected website and effective Nginx access_log/error_log directives if the viewer shows no matching entries.
3. Locate the request in the access log
The access log tells you that the server handled a request and records configured fields such as method, path, status and byte count. Our matching entry contained:
Code:
[14/Oct/2026:12:40:54 +0000]
GET /af-log-troubleshooting-missing-20261014.txt HTTP/2.0
404Match the time, hostname, path and method rather than assuming the latest error belongs to your browser. Check browser/CDN caching and timezone differences when the times seem inconsistent.
4. Match the error log at the same time
At 12:40:54 UTC, our error log reported an open() failure for the expected file under /www/wwwroot/adminslab.com, with error 2: No such file or directory.
This supported a missing-file diagnosis for this static test URL. We created only that temporary file at the expected root path and repeated the request. At 12:41:34 UTC the response was HTTP 200 with the intended test content, and the access log recorded 200.
AdminsForum formatted transcript of our synthetic request and matching log entries, not a screenshot. Unrelated visitor entries are excluded.
We removed the fixture after verification. This was a lab demonstration, not a recommendation to create an empty file whenever a route returns 404. An application route may instead require the right document root or rewrite rules. For WordPress pretty URLs, see the permalink 404 guide.
5. Read common messages as clues
- No such file or directory: inspect the exact path, document root, deployment contents or upstream socket named by the message. A missing static file and a missing FPM socket have different fixes.
- Permission denied: identify the object, runtime user and required access. Review ownership, parent-directory traversal and applicable security controls; do not recursively apply chmod 777.
- Connection refused while connecting to upstream: inspect the configured upstream and whether the intended service is listening. Check its own error/startup logs before restarting it.
- Upstream timed out: investigate the upstream's workload and dependencies. Raising a timeout without finding the delay can keep resources occupied longer.
- PHP fatal/uncaught exception: locate the application stack and matching runtime log, then review the relevant code, dependency and recent change. A 500 is not always a PHP syntax error.
6. Know the difference between PHP-FPM and application logs
The lab FPM master error_log was /www/server/php/85/var/log/php-fpm.log. This captures FPM service diagnostics; it is not a guarantee that every PHP application's warning appears there.
A private FPM settings probe confirmed PHP loaded /www/server/php/85/etc/php.ini, with log_errors enabled, display_errors off and no explicit PHP error_log path. An empty PHP error_log value delegates the destination to the SAPI. Inspect the effective runtime, web-server FastCGI error output and application logger rather than assuming a file name.
The CLI runtime can load a different ini file. Never publish phpinfo or stack traces on an unprotected website just to discover a setting. Our probe was outside the web root, used through the private socket and removed afterwards.
PHP slow logs answer a different question: where a long-running worker was executing. Follow the tested slow-log guide for that workflow.
7. Check the application logger
Frameworks and CMS plugins may capture exceptions in their own log location or service journal. Check the application's documented logging configuration and make sure the runtime can write to its intended private directory.
For WordPress, official debug logging supports a chosen file path while display can remain disabled. Use a staging copy and backup before temporary debug changes; do not expose wp-content/debug.log publicly or leave development debugging enabled on a live site. This article did not alter WordPress debug settings.
For a database-related exception, examine the corresponding database evidence and query. A web-server access log usually cannot tell you which SQL statement was slow or failed.
8. Search bounded log output through SSH
If the panel cannot reach an older entry, use the actual private log paths:
Code:
tail -n 100 /www/wwwlogs/example.com.error.log
grep -F -- '/problem-path' /www/wwwlogs/example.com.log
tail -F /www/wwwlogs/example.com.error.logA rotated log may contain yesterday's evidence. Read the appropriate archive with supported tools; do not clear or delete logs merely to make the view shorter. Preserve useful evidence and maintain deliberate retention.
9. When no matching entry appears
Confirm that the request reached the expected server and virtual host. Check DNS, CDN responses, HTTPS/redirect paths, selected website, enabled logging and rotation. Some locations intentionally suppress logging; absence of an entry does not prove the request never happened.
If the web server cannot start, a per-site access log may be irrelevant. Inspect the server's startup/configuration error and validate the actual panel-managed configuration. For our Nginx installation the syntax check is:
Code:
/www/server/nginx/sbin/nginx -t10. Verify the fix and ask for help with safe evidence
Change one identified cause, repeat the same request, inspect the new status and content, and confirm the matching fresh log entry. Check a normal page too. An old error remaining in the log does not mean the fix failed: compare timestamps.
When posting support details, include versions, affected path, time/timezone, status, last change and a small redacted matching excerpt. Remove credentials, cookies, tokens, private email addresses, visitor IPs and unrelated user data. Logs are evidence to interpret, not instructions to execute.
References: Nginx beginner's guide, PHP error logging configuration and WordPress debugging documentation.