



Yesterday, 10:25 AM
Before restarting services or increasing a VPS plan, check disk capacity, memory availability, CPU load and listening ports. These read-only SSH checks help identify the resource or component that needs closer investigation.
Tested: Ubuntu 22.04.5 on our aaPanel Free 8.0.7 lab VPS. Commands inspect the server; they do not delete files, kill processes or change firewall rules. The recorded numbers are a point-in-time snapshot, not a performance benchmark or capacity guarantee.
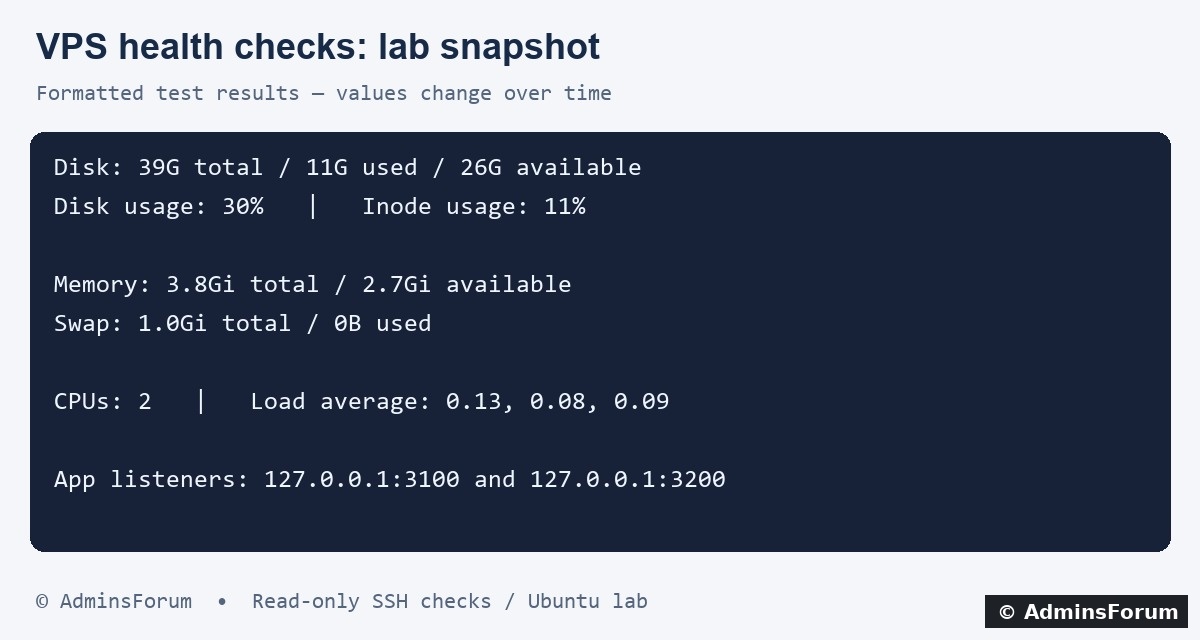
Formatted transcript of the lab's disk, memory, CPU and local application listener checks.
1. Check filesystem capacity
From your authorized SSH session:
Read Size, Used, Avail and Use%. In our lab both paths are on the same /dev/vda2 filesystem, so two lines describe the same capacity rather than two separate disks. The snapshot showed 39G total, 11G used, 26G available and 30% usage.
Run the check against the actual filesystem holding your website, database and backups. A different mounted data disk can be full even when the root filesystem is not.
2. Check inode capacity too
Inodes track filesystem objects. A workload with many small files can exhaust available inodes even when data space remains. Our snapshot showed 11% inode usage. If space or inodes are nearly exhausted, identify the source before deleting anything.
3. Inspect specific directory sizes
Our results were 287M for backups and 9.2M for website logs. This command measures those directories, not every possible source of disk use. Use bounded paths first rather than scanning the entire VPS during a busy period; even read-only directory scans can consume I/O.
Do not delete active database files or blindly remove logs. Review backup retention and log rotation, preserve needed evidence and confirm a restore before discarding recovery copies. If df and du disagree, investigate causes such as deleted files still held open by a process or different mount scopes.
4. Read memory availability
Our lab showed 3.8Gi total memory, 2.7Gi available and a 1.0Gi swap area with no swap used at the time.
Look at available, not just free. Linux uses memory for buffers and cache, and some can be reclaimed for applications. A small free column alone does not prove a memory shortage. Conversely, one healthy sample does not rule out spikes or a memory leak.
Sustained low availability and swap activity warrant investigation alongside application latency and logs. Do not assume adding swap solves every workload problem.
5. Compare CPU count with load over time
Our snapshot reported two available processing units and load averages of 0.13, 0.08 and 0.09. Uptime lists the 1-, 5- and 15-minute load averages.
Load average is not CPU percentage: it includes runnable work and tasks waiting in uninterruptible sleep, including some I/O waits. Compare it with available CPUs and the workload trend, then investigate CPU and I/O behavior before concluding the server needs more cores.
6. Identify large processes without dumping arguments
This prints process ID, user, command name and reported CPU/memory percentages, sorted by memory percentage. We tested it and saw MariaDB, aaPanel and PHP-FPM among the larger processes.
The command-name field avoids dumping full arguments, which can contain credentials. This is a quick process summary, not a complete memory accounting report or instantaneous CPU profiler. Do not kill a database or panel process just because it appears near the top.
7. Check listening TCP ports
This lists listening TCP sockets with numeric addresses. A focused application check in our lab was:
The Node app listened on 127.0.0.1:3100 and Flask on 127.0.0.1:3200. These localhost listeners are reached through Nginx; they are not directly exposed on public interfaces.
A listener on 0.0.0.0 accepts connections on IPv4 interfaces at the socket level, but firewall and provider rules can still block traffic. A listening socket does not prove outside reachability, authentication or correct application content. Verify a real request separately. Review expected listeners and avoid posting your private management entrance or raw credential-bearing output.
8. Turn the findings into a targeted next check
What this lesson verified
We ran df, inode checks, bounded du, free, uptime, nproc, a process summary and TCP-listener checks on the lab. No service restart, cleanup, firewall modification or resource upgrade was performed. Repeat observations across the period when a problem occurs; one calm sample cannot prove peak-load capacity.
AdminsForum CLI series. Illustration is a formatted lab-result transcript and the values will change over time.
Tested: Ubuntu 22.04.5 on our aaPanel Free 8.0.7 lab VPS. Commands inspect the server; they do not delete files, kill processes or change firewall rules. The recorded numbers are a point-in-time snapshot, not a performance benchmark or capacity guarantee.
Formatted transcript of the lab's disk, memory, CPU and local application listener checks.
1. Check filesystem capacity
From your authorized SSH session:
Code:
df -h / /wwwRun the check against the actual filesystem holding your website, database and backups. A different mounted data disk can be full even when the root filesystem is not.
2. Check inode capacity too
Code:
df -i / /www3. Inspect specific directory sizes
Code:
du -sh /www/backup /www/wwwlogsDo not delete active database files or blindly remove logs. Review backup retention and log rotation, preserve needed evidence and confirm a restore before discarding recovery copies. If df and du disagree, investigate causes such as deleted files still held open by a process or different mount scopes.
4. Read memory availability
Code:
free -hLook at available, not just free. Linux uses memory for buffers and cache, and some can be reclaimed for applications. A small free column alone does not prove a memory shortage. Conversely, one healthy sample does not rule out spikes or a memory leak.
Sustained low availability and swap activity warrant investigation alongside application latency and logs. Do not assume adding swap solves every workload problem.
5. Compare CPU count with load over time
Code:
nproc
uptimeLoad average is not CPU percentage: it includes runnable work and tasks waiting in uninterruptible sleep, including some I/O waits. Compare it with available CPUs and the workload trend, then investigate CPU and I/O behavior before concluding the server needs more cores.
6. Identify large processes without dumping arguments
Code:
ps -eo pid,user,comm,%cpu,%mem --sort=-%mem | head -8The command-name field avoids dumping full arguments, which can contain credentials. This is a quick process summary, not a complete memory accounting report or instantaneous CPU profiler. Do not kill a database or panel process just because it appears near the top.
7. Check listening TCP ports
Code:
ss -lntCode:
ss -lnt | grep -E ':3100|:3200'A listener on 0.0.0.0 accepts connections on IPv4 interfaces at the socket level, but firewall and provider rules can still block traffic. A listening socket does not prove outside reachability, authentication or correct application content. Verify a real request separately. Review expected listeners and avoid posting your private management entrance or raw credential-bearing output.
8. Turn the findings into a targeted next check
- Filesystem nearly full: inspect the actual mount, backups, logs and inode use; plan safe retention or capacity changes.
- Memory pressure: inspect process trends, worker settings and relevant application errors.
- High sustained load: compare CPU count, CPU use and I/O behavior rather than equating load with percent usage.
- Expected listener missing: check the corresponding service's status and startup logs.
- Resources look healthy but site fails: investigate DNS, TLS, upstream mapping and application errors.
What this lesson verified
We ran df, inode checks, bounded du, free, uptime, nproc, a process summary and TCP-listener checks on the lab. No service restart, cleanup, firewall modification or resource upgrade was performed. Repeat observations across the period when a problem occurs; one calm sample cannot prove peak-load capacity.
AdminsForum CLI series. Illustration is a formatted lab-result transcript and the values will change over time.