



Yesterday, 12:17 PM
A slow website does not automatically need a larger database buffer or more connections. First identify the query, inspect its execution plan and measure a targeted change. This guide demonstrates that workflow in a separate MariaDB lab database.
Tested environment: aaPanel Free 8.0.7, Ubuntu 22.04.5 and MariaDB 10.11.10. MySQL and MariaDB releases differ; verify your installed version before copying configuration advice. We used 50,000 synthetic rows and changed no global database settings.
1. Identify the database and establish a baseline
Open aaPanel → Databases and confirm which service and database the website uses. Inspect application logs and slow queries rather than assuming the homepage represents all workloads. Administrative diagnostics require suitable database permissions; keep credentials out of commands, screenshots and public tutorials.
Our lab had a 384MiB InnoDB buffer pool, max_connections 200, slow logging enabled and a 3-second threshold. Maximum used connections was 3 at that observation. These are observations, not recommended settings for every server.
Counters may accumulate since startup. Take interval snapshots under representative traffic; a one-time cache ratio is not enough to justify allocating more RAM.
2. Find the actual slow query
If slow logging is enabled, review its configured path through an administrator session. Logs can contain query text and user data: keep access restricted and do not upload raw logs to a public thread. A 3-second threshold will miss many shorter queries; choose a diagnostic threshold deliberately and monitor storage overhead.
Find frequently repeated queries as well as individually expensive ones. Record execution count, latency and examined rows. A fast query executed thousands of times may still consume significant resources.
3. Create a separate practice database
Use a disposable database, never a production table, for this example. Our new database was af_performance_index_lab_20261014. In MariaDB 10.11, the sequence table below provides synthetic integers; this syntax is not a portable MySQL recipe.
Check that your chosen database name does not already exist. This example creates only synthetic data; adapt names and versions for your own isolated lab.
4. Inspect the query plan before changing anything
SQL_NO_CACHE is used here to exclude MariaDB's query-result cache; it does not empty the InnoDB buffer pool. Do not copy this clause into an incompatible database release.
Our plan showed type ALL and an estimated 50,000 rows. EXPLAIN estimates are not measured execution counts, but this plan indicates a full table scan to evaluate the filters.
The query returned 50 matching rows. Record the result so that a faster but incorrect rewrite is not accepted.
5. Test a targeted composite index
The new plan used idx_account_status, type ref and an estimated 50 rows. It also reported Using index: this count query can be satisfied from the index entries needed for the filters.
Index design depends on the actual predicates, sorting and joins. Column order matters for other queries using only part of a composite index. Avoid creating an index for every column: indexes use storage and add work to writes.
On a large production table, building an index can consume time, space and locks. Check version-specific online DDL behavior, back up and plan the change before applying it to real data.
6. Compare the same query
We used MariaDB session profiling for this lab: one warmup followed by ten measured executions in each phase. The same database session setting and query were used before and after. Warm data remained possible in the buffer pool; this is not a cold-storage benchmark.
Repeat the SELECT for your sample and inspect its reported duration. Session profiling is version-specific; use the diagnostic tools available in your actual database release. Disable temporary profiling when finished.
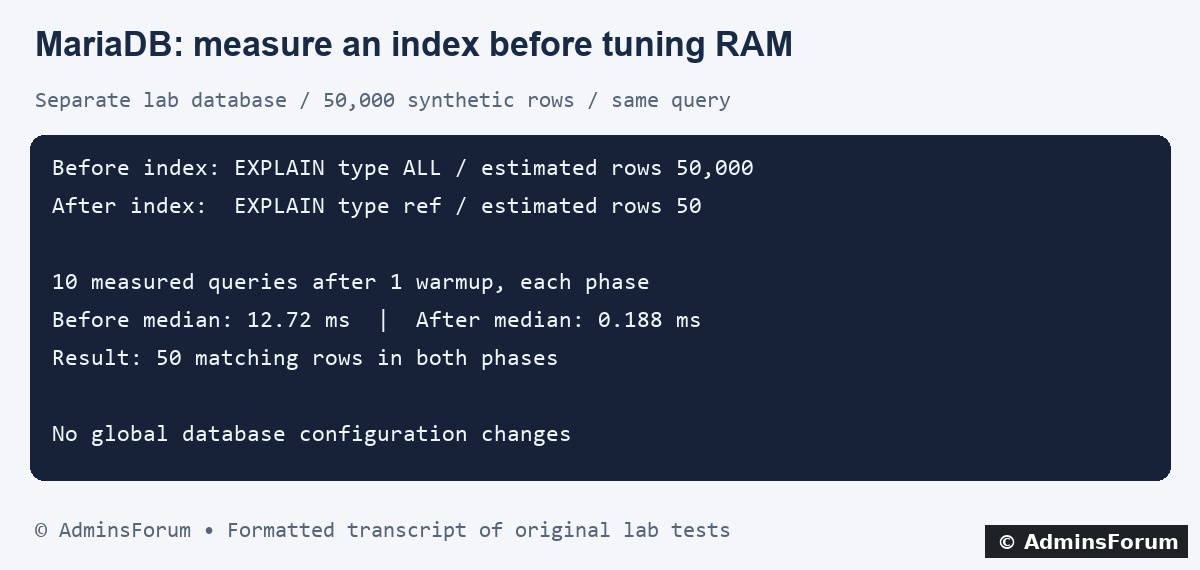
AdminsForum formatted transcript of the original lab test, not a terminal screenshot.
The median of ten measured executions was about 12.72ms before and 0.188ms after. Both phases returned 50 rows. This supports this index for this synthetic query; it does not promise the same improvement for every website or establish production capacity.
7. Tune resources only after reviewing evidence
For InnoDB buffer sizing, account for the working data set and sustained physical reads, while reserving memory for PHP-FPM, Nginx, OS, mail and other services. Dedicated database-server percentage rules are unsuitable for every shared aaPanel VPS.
For max_connections, inspect concurrent connections, application pooling and per-connection memory. Raising the limit can worsen overload. Our observed maximum of 3 did not justify increasing the limit of 200.
Change one setting at a time, retain its original value, validate the database configuration and repeat representative workloads. Monitor swap, OOM events, errors and query latency. A restart can temporarily alter cache warmth and distort comparisons.
8. Verify the website and retain a rollback plan
Test real reads and writes, not just this SELECT. Compare execution plans and results, then monitor normal traffic. For our disposable table, the index can be removed with:
Do not remove an existing production index without checking its other uses. We retained this isolated lab database and its index for repeatable demonstrations; no application database was modified.
Continue with PHP-FPM memory limits to balance the shared server, rather than tuning each service as though it owns all RAM.
References: MariaDB EXPLAIN and SHOW PROFILES.
Tested environment: aaPanel Free 8.0.7, Ubuntu 22.04.5 and MariaDB 10.11.10. MySQL and MariaDB releases differ; verify your installed version before copying configuration advice. We used 50,000 synthetic rows and changed no global database settings.
1. Identify the database and establish a baseline
Open aaPanel → Databases and confirm which service and database the website uses. Inspect application logs and slow queries rather than assuming the homepage represents all workloads. Administrative diagnostics require suitable database permissions; keep credentials out of commands, screenshots and public tutorials.
Code:
SELECT VERSION();
SHOW VARIABLES WHERE Variable_name IN
('innodb_buffer_pool_size','max_connections','slow_query_log','long_query_time');
SHOW GLOBAL STATUS WHERE Variable_name IN
('Threads_connected','Max_used_connections','Innodb_buffer_pool_reads','Innodb_buffer_pool_read_requests');Counters may accumulate since startup. Take interval snapshots under representative traffic; a one-time cache ratio is not enough to justify allocating more RAM.
2. Find the actual slow query
If slow logging is enabled, review its configured path through an administrator session. Logs can contain query text and user data: keep access restricted and do not upload raw logs to a public thread. A 3-second threshold will miss many shorter queries; choose a diagnostic threshold deliberately and monitor storage overhead.
Find frequently repeated queries as well as individually expensive ones. Record execution count, latency and examined rows. A fast query executed thousands of times may still consume significant resources.
3. Create a separate practice database
Use a disposable database, never a production table, for this example. Our new database was af_performance_index_lab_20261014. In MariaDB 10.11, the sequence table below provides synthetic integers; this syntax is not a portable MySQL recipe.
Code:
CREATE DATABASE af_performance_index_lab_20261014;
USE af_performance_index_lab_20261014;
CREATE TABLE events (
  id INT PRIMARY KEY,
  account_id INT NOT NULL,
  status VARCHAR(16) NOT NULL,
  payload VARCHAR(100) NOT NULL
) ENGINE=InnoDB;
INSERT INTO events
SELECT seq, MOD(seq,1000),
       IF(MOD(seq,2)=0,'active','closed'), REPEAT('x',100)
FROM seq_1_to_50000;4. Inspect the query plan before changing anything
Code:
EXPLAIN SELECT SQL_NO_CACHE COUNT(*)
FROM events WHERE account_id=321 AND status='closed';Our plan showed type ALL and an estimated 50,000 rows. EXPLAIN estimates are not measured execution counts, but this plan indicates a full table scan to evaluate the filters.
The query returned 50 matching rows. Record the result so that a faster but incorrect rewrite is not accepted.
5. Test a targeted composite index
Code:
ALTER TABLE events
  ADD INDEX idx_account_status(account_id,status);
ANALYZE TABLE events;
EXPLAIN SELECT SQL_NO_CACHE COUNT(*)
FROM events WHERE account_id=321 AND status='closed';Index design depends on the actual predicates, sorting and joins. Column order matters for other queries using only part of a composite index. Avoid creating an index for every column: indexes use storage and add work to writes.
On a large production table, building an index can consume time, space and locks. Check version-specific online DDL behavior, back up and plan the change before applying it to real data.
6. Compare the same query
We used MariaDB session profiling for this lab: one warmup followed by ten measured executions in each phase. The same database session setting and query were used before and after. Warm data remained possible in the buffer pool; this is not a cold-storage benchmark.
Code:
SET profiling=1;
SELECT SQL_NO_CACHE COUNT(*)
FROM events WHERE account_id=321 AND status='closed';
SHOW PROFILES;AdminsForum formatted transcript of the original lab test, not a terminal screenshot.
The median of ten measured executions was about 12.72ms before and 0.188ms after. Both phases returned 50 rows. This supports this index for this synthetic query; it does not promise the same improvement for every website or establish production capacity.
7. Tune resources only after reviewing evidence
For InnoDB buffer sizing, account for the working data set and sustained physical reads, while reserving memory for PHP-FPM, Nginx, OS, mail and other services. Dedicated database-server percentage rules are unsuitable for every shared aaPanel VPS.
For max_connections, inspect concurrent connections, application pooling and per-connection memory. Raising the limit can worsen overload. Our observed maximum of 3 did not justify increasing the limit of 200.
Change one setting at a time, retain its original value, validate the database configuration and repeat representative workloads. Monitor swap, OOM events, errors and query latency. A restart can temporarily alter cache warmth and distort comparisons.
8. Verify the website and retain a rollback plan
Test real reads and writes, not just this SELECT. Compare execution plans and results, then monitor normal traffic. For our disposable table, the index can be removed with:
Code:
ALTER TABLE events DROP INDEX idx_account_status;Continue with PHP-FPM memory limits to balance the shared server, rather than tuning each service as though it owns all RAM.
References: MariaDB EXPLAIN and SHOW PROFILES.