



Yesterday, 12:35 PM
PHP-FPM's slow log can show where a PHP request was executing after it crossed a time threshold. Use that evidence to investigate application work before raising worker counts or timeouts.
Tested: aaPanel Free 8.0.7, Ubuntu 22.04.5 and PHP 8.5.11. We ran one synthetic four-second request through the private PHP-FPM Unix socket. It generated a slow-log trace, after which we restored the original pool settings and removed the test script. No production website was changed.
1. Identify the PHP version and pool
Check the website's selected PHP version in aaPanel. Inspect its Nginx PHP handler if you administer the server. Our site used /tmp/php-cgi-85.sock and pool www. The default command-line PHP binary may load a different configuration and cannot prove which pool serves the site.
The lab pool configuration was /www/server/php/85/etc/php-fpm.conf. Version numbers and paths vary: discover the actual file before editing. Read the PHP-FPM worker guide for the distinction between worker limits and request cost.
2. Check existing logging settings
Our original configuration included:
A request below the slow-log threshold will not generate a slow trace simply because a visitor considers it slow. The relative log path must be interpreted in the running FPM installation; do not assume it is inside the website directory. We used an explicit absolute path for the experiment to avoid that ambiguity.
The slow-log threshold requests a diagnostic backtrace. The termination timeout is a separate setting that can kill a long-running worker request; we left it unchanged. Raising either is not a cure for slow SQL or an unavailable API.
3. Back up and select a diagnostic threshold
Keep an original copy of the pool configuration and a working SSH recovery route. On a shared PHP version, the change can affect several websites. Choose a threshold suited to the symptom and a limited observation window, rather than permanently logging every ordinary request.
For our isolated lab example we temporarily used:
Keep logs outside publicly served directories and restrict access. Paths and stack traces can reveal implementation details. Use your own private log path and ensure the FPM master can open it; avoid broad permission changes such as chmod 777.
4. Validate before reloading
On this lab installation:
The configuration test passed. Reload only after success and inspect application health afterwards. Use the service names and binary for your selected version. A valid configuration does not guarantee the diagnostic backtrace will succeed on every container or host; inspect FPM errors if tracing is restricted.
5. Generate one controlled slow request
Our test script contained only:
It was stored outside the website root and executed through cgi-fcgi over /tmp/php-cgi-85.sock using a local administrator session. The request had a client timeout and completed in about 4.004 seconds. We did not publish a slow test URL, start a traffic loop or trigger real customer actions.
If reproducing this lesson, use an isolated lab and its actual private socket. Do not upload a deliberate delay script to a public production website. For a real symptom, collect traces from a bounded legitimate test workflow instead.
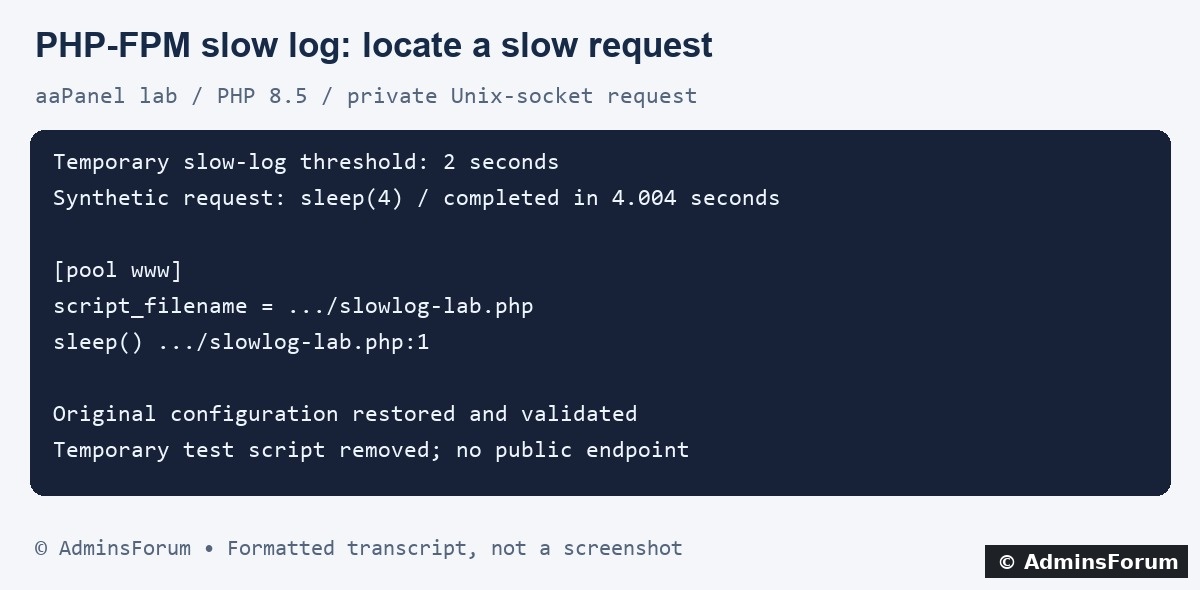
AdminsForum formatted transcript of the original lab result, not a terminal screenshot. The image abbreviates the private diagnostic path.
6. Read the trace
The log named pool www and the test script, then identified sleep() on line 1. That is consistent with the intentional waiting operation. It confirms that slow logging worked for this request.
A trace is a snapshot of execution, not a complete timeline or a ranked profiler. A function visible in one sample is not automatically the root cause. Compare several relevant traces and correlate the request time with application, database and web-server evidence.
7. Follow the evidence to the right component
8. Restore and verify
Our test restored the original configuration byte for byte, validated it and reloaded the service. We removed the temporary script and retained the private trace and backup for documentation. The original 30-second threshold and existing log path were restored; the termination limit was unchanged.
After your diagnostic window, restore the previous settings or choose a deliberate long-term policy with log retention and disk monitoring. Keep raw traces private and redact paths and user-related details before asking for public help.
9. Retest the actual fix
Change one identified cause, repeat the same meaningful workflow and compare response time, errors and resource use. Keep a rollback plan. Disabling diagnostics, adding workers or increasing a timeout without evidence does not establish that the cause was fixed.
Reference: Official PHP-FPM configuration documentation.
Tested: aaPanel Free 8.0.7, Ubuntu 22.04.5 and PHP 8.5.11. We ran one synthetic four-second request through the private PHP-FPM Unix socket. It generated a slow-log trace, after which we restored the original pool settings and removed the test script. No production website was changed.
1. Identify the PHP version and pool
Check the website's selected PHP version in aaPanel. Inspect its Nginx PHP handler if you administer the server. Our site used /tmp/php-cgi-85.sock and pool www. The default command-line PHP binary may load a different configuration and cannot prove which pool serves the site.
The lab pool configuration was /www/server/php/85/etc/php-fpm.conf. Version numbers and paths vary: discover the actual file before editing. Read the PHP-FPM worker guide for the distinction between worker limits and request cost.
2. Check existing logging settings
Our original configuration included:
Code:
request_slowlog_timeout = 30
slowlog = var/log/slow.log
request_terminate_timeout = 100The slow-log threshold requests a diagnostic backtrace. The termination timeout is a separate setting that can kill a long-running worker request; we left it unchanged. Raising either is not a cure for slow SQL or an unavailable API.
3. Back up and select a diagnostic threshold
Keep an original copy of the pool configuration and a working SSH recovery route. On a shared PHP version, the change can affect several websites. Choose a threshold suited to the symptom and a limited observation window, rather than permanently logging every ordinary request.
For our isolated lab example we temporarily used:
Code:
request_slowlog_timeout = 2
slowlog = /www/server/php/85/var/log/af-slowlog-lab-20261014.log4. Validate before reloading
On this lab installation:
Code:
/www/server/php/85/sbin/php-fpm -t
/etc/init.d/php-fpm-85 reload5. Generate one controlled slow request
Our test script contained only:
Code:
<?php
sleep(4);
echo "AdminsForum slow-log lab completed\n";If reproducing this lesson, use an isolated lab and its actual private socket. Do not upload a deliberate delay script to a public production website. For a real symptom, collect traces from a bounded legitimate test workflow instead.
AdminsForum formatted transcript of the original lab result, not a terminal screenshot. The image abbreviates the private diagnostic path.
6. Read the trace
The log named pool www and the test script, then identified sleep() on line 1. That is consistent with the intentional waiting operation. It confirms that slow logging worked for this request.
A trace is a snapshot of execution, not a complete timeline or a ranked profiler. A function visible in one sample is not automatically the root cause. Compare several relevant traces and correlate the request time with application, database and web-server evidence.
7. Follow the evidence to the right component
- A database call in the trace: identify the corresponding query and inspect its plan and database timing. Follow the EXPLAIN and index test guide.
- An HTTP/API operation: inspect destination latency, connection errors and application timeout handling. Do not repeatedly retry a side-effecting request just to gather samples.
- Repeated application functions: use a suitable application profiler in a controlled environment and compare expensive paths. The slow log alone does not quantify every function's cost.
- Many occupied workers: combine traces with CPU, memory and FPM queue observations. Queueing before a request starts running in a worker may not be explained by its eventual slow trace.
8. Restore and verify
Our test restored the original configuration byte for byte, validated it and reloaded the service. We removed the temporary script and retained the private trace and backup for documentation. The original 30-second threshold and existing log path were restored; the termination limit was unchanged.
After your diagnostic window, restore the previous settings or choose a deliberate long-term policy with log retention and disk monitoring. Keep raw traces private and redact paths and user-related details before asking for public help.
9. Retest the actual fix
Change one identified cause, repeat the same meaningful workflow and compare response time, errors and resource use. Keep a rollback plan. Disabling diagnostics, adding workers or increasing a timeout without evidence does not establish that the cause was fixed.
Reference: Official PHP-FPM configuration documentation.